After years of SRE interview loops, I started keeping a running list of every question I was asked. What struck me was the sheer range of things an SRE is expected to know: sysadmin, DevOps engineer, developer, DBA and production engineer, all in the same hour. I did not have every answer when I was first asked these questions. I wrote down what came up, practised saying the answer out loud, researched the parts I got wrong, and kept refining it until it held up. This is that collection, organised the way a real loop runs: reliability fundamentals, observability, live troubleshooting, coding, and system design with security to finish. Every answer includes the follow-up an interviewer is likely to ask next, because that second question is where most candidates are actually assessed. Hope it helps someone else preparing for theirs.
How to use it:
- Short on time? Jump to the cheat sheet at the end.
- Preparing properly? Work through one section per sitting and say each answer out loud. The “What they are testing” notes tell you what a strong answer has to contain.
Table of contents
Open Table of contents
- Reliability fundamentals
- 1. What is the difference between an SLI, an SLO and an SLA?
- 2. You have an SLA of 95%. How would you design your SLOs?
- 3. What is toil, and how have you automated it?
- 4. How would you design a “Big Red Button”?
- 5. How do you run an incident and a blameless postmortem?
- 6. Compare deployment strategies. Which would you use?
- Observability and alerting
- Live troubleshooting
- Coding for operations
- System design, infrastructure and security
- 18. How do you build resilience and reliability in the cloud?
- 19. Horizontal versus vertical scaling
- 20. How would you build a scalable architecture on AWS?
- 21. Terraform: where is state stored, and what goes wrong across multiple accounts?
- 22. Design a configuration management and deployment platform for 200+ services
- 23. Capacity planning and disaster recovery (RTO and RPO)
- 24. Explain the CAP theorem and consistency models
- 25. Load balancing algorithms, and L4 versus L7
- 26. Distributed locking and leader election
- 27. Message queues: at-least-once versus exactly-once
- 28. How would you implement platform SRE?
- 29. What security would you add to a CI/CD pipeline?
- 30. What security monitoring would you set up for a website?
- Quick-reference cheat sheet
- Final thought
Reliability fundamentals
This round checks whether you think in terms of user impact, risk budgets and recovery, rather than uptime percentages and heroics.
1. What is the difference between an SLI, an SLO and an SLA?
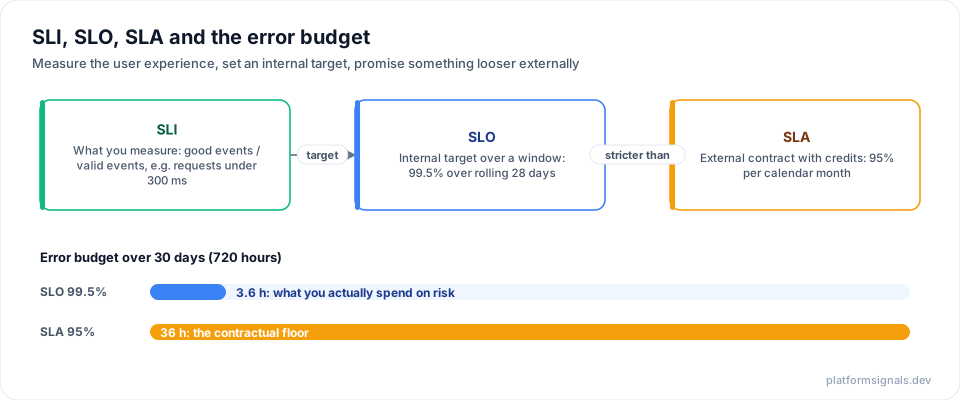
| Term | What it is | Example | Who it is for |
|---|---|---|---|
| SLI (indicator) | A measurement of user experience, expressed as good events / valid events | Proportion of HTTP requests that return non-5xx in under 300 ms | Engineers |
| SLO (objective) | An internal target for an SLI over a window | 99.5% of requests are good, over a rolling 28 days | The team and the business |
| SLA (agreement) | An external contract with consequences if missed | 95% monthly availability, or service credits apply | Customers and legal |
The relationship is SLI measures, SLO targets, SLA promises. The SLO is deliberately stricter than the SLA, so you burn through your own internal budget, and react, long before you are in breach of contract.
The error budget is 1 - SLO. At a 99.5% SLO over 30 days, that is 3.6 hours of “badness” you are allowed to spend on releases, experiments and maintenance. When it is gone, you slow down and spend engineering time on reliability instead.
What they are testing: that you define an SLI as a ratio of good to valid events, and that you see the error budget as a decision-making tool, not just a number.
2. You have an SLA of 95%. How would you design your SLOs?
Start from the user, then check against the contract. The SLO should reflect the level at which users stop being happy, with the SLA as a floor it must clear comfortably. “SLA plus a margin” is a reasonable sanity check but a poor design method: an SLO far tighter than users need creates toil and freezes releases for no benefit.
- Set the SLO above the SLA with a deliberate cushion. For a 95% SLA, something in the 98% to 99.5% range is typical, depending on what users actually notice.
- Account for the dependency chain. Availability compounds. Three hard dependencies at 99.5% each give roughly 0.995³ ≈ 98.5% before your own code fails anything, so set component SLOs with that multiplication in mind.
- Use a shorter, rolling window. If the SLA is reported monthly, evaluate the SLO over a rolling 7 or 28 days so you see trouble early rather than at month end.
- Do the budget arithmetic. 30 days is 720 hours. A 95% SLA allows 36 hours of bad time; a 99.5% SLO allows 3.6 hours. The SLO budget is the one you manage day to day.
- Split SLOs by request class. Checkout and login deserve a tighter objective than static assets or a reporting endpoint.
- Alert on burn rate, not on the threshold. Use the multi-window, multi-burn-rate approach from the Google SRE Workbook:
| Severity | Long window | Short window | Burn rate | Budget consumed |
|---|---|---|---|---|
| Page | 1 hour | 5 minutes | 14.4x | 2% |
| Page | 6 hours | 30 minutes | 6x | 5% |
| Ticket | 3 days | 6 hours | 1x | 10% |
The short window stops the alert from firing long after the problem has recovered. A fast-burn page for a 99.9% SLO looks like this in PromQL:
(
  sum(rate(http_requests_total{job="api", code=~"5.."}[1h]))
  / sum(rate(http_requests_total{job="api"}[1h]))
) > (14.4 * 0.001)
and
(
  sum(rate(http_requests_total{job="api", code=~"5.."}[5m]))
  / sum(rate(http_requests_total{job="api"}[5m]))
) > (14.4 * 0.001)
Follow-up: how do you define SLIs for a website?
Pick SLIs that map to what a user experiences:
| SLI type | Definition | Where to measure |
|---|---|---|
| Availability | Proportion of requests that are not 5xx | Load balancer or edge logs |
| Latency | Proportion of requests served under a threshold, for example under 300 ms. The SLO then says what proportion must meet it (say 95%) | Server side, plus RUM for real client experience |
| Correctness | Proportion of responses that did the right thing (checkout completed, search returned results) | Application events |
| Freshness | How stale served data is compared with the source of truth | Data pipeline metadata |
| Durability | Proportion of writes that are never lost | Storage layer |
Measure at the reverse proxy or load balancer (NGINX, Envoy, ALB) because it is the closest point to the user without client instrumentation, and add synthetic probes (Blackbox exporter, Pingdom) for an outside-in view that also catches DNS, TLS and CDN failures.
What they are testing: whether you keep the SLI as a proportion and the target in the SLO. Saying “p95 latency is my SLI” is a common slip.
3. What is toil, and how have you automated it?
Google’s SRE book defines toil as work that is manual, repetitive, automatable, tactical, has no enduring value, and scales linearly with service growth. SRE teams cap it (the Google guideline is under 50% of an engineer’s time) because unchecked toil crowds out the engineering that would remove it.
Worked example: disk-full pages
| Before | After | |
|---|---|---|
| Trigger | Page at 90% disk on a log volume, several times a week | Warning threshold triggers automatic clean-up first |
| Response | SSH in, find old logs, delete or rotate them by hand | logrotate with compression and retention; a Lambda or cron job clears safe paths |
| Paging | Every occurrence | Only when usage is still critical after automation ran, which signals a real bug |
| Root cause | Never addressed | A service logging at DEBUG in production, fixed at source |
The result is that a routine page disappears, and the pages that remain are genuine anomalies.
Other strong examples: certificate and credential rotation, ChatOps commands that replace runbook steps, self-service access requests, automated restore testing, and auto-remediation for well-understood alerts (restarting a crash-looping pod rather than paging someone to run kubectl rollout restart).
From the field (placeholder, replace before publishing): One piece of toil you eliminated at scale. What it cost the team each week before, what you built, and the measurable result.
4. How would you design a “Big Red Button”?
A Big Red Button (BRB) is a pre-built, pre-tested way to return a system to a known-good state during an incident, without needing a diagnosis first. Stop the bleeding now, find the root cause later.
Design principles
- Target the changes most likely to hurt. The latest deploy or config push, a risky feature flag, a traffic migration, a misbehaving autoscaler.
- Make it one action. One command or one button that rolls back to the last known-good version, or one flag flip that routes all traffic to the old path. No improvised sequence of steps at 3am.
- Keep it independent of what it fixes. If the deploy system might be broken, the rollback cannot depend on it. Store the kill switch in a separately hosted flag or config service.
- Make it safe for any on-call engineer to press. Idempotent, itself reversible, and with a small blast radius of its own.
- Avoid a thundering herd. Shift traffic back gradually, drain connections and keep fallback caches warm.
- Test it regularly. In game days and chaos drills. The rollback path is the least exercised code in most systems, which is why it fails when you need it.
- Make state compatible with rollback. Use expand and contract schema migrations. If a change cannot be reverted instantly, flag that before rollout, not during the incident.
- Notify and audit. Pressing the button tells stakeholders and records what was reverted, by whom and when.
- Keep the scope narrow. Several specific buttons (traffic routing, flags, deploys) are safer than one global “revert everything”.
The theme is the same as the rest of SRE: optimise for fast, safe recovery (MTTR), because incidents will happen and what separates mature systems is how quickly they can be undone.
From the field (placeholder, replace before publishing): A time a fast rollback or kill switch saved an incident, or a time the lack of one made it worse.
5. How do you run an incident and a blameless postmortem?
During the incident
- Severity levels agreed in advance. For example SEV1 full outage, SEV2 major degradation, SEV3 limited impact. Severity sets paging urgency, who joins and how often you communicate, so it should never be debated mid-incident.
- An Incident Commander. One person coordinates and decides, and is usually not the person fixing it. They delegate investigation, communication and mitigation, and decide when to escalate or press the Big Red Button.
- One channel and a fixed update cadence. A dedicated incident channel, a status document updated every 15 to 30 minutes, and a separate, simpler external status page, so responders are not interrupted for updates.
- Mitigate first. Roll back, fail over, scale up or disable a feature. Full root cause analysis waits until users are no longer affected.
- Capture the timeline as you go. Timestamped actions and decisions, written live, become the backbone of the postmortem.
After the incident
- Blameless means assuming everyone acted reasonably with what they knew at the time. The goal is to find system and process gaps. Blame makes people hide information, which makes the next incident worse.
- Structure: impact (who, what, how long), timeline, contributing factors, what went well, what went badly, and action items with owners and dates.
- Go past the trigger. “A bad config was pushed” is the trigger. The systemic questions are why the pipeline allowed an unvalidated config into production, and why the canary did not catch it. The “5 Whys” technique helps.
- Track action items to completion. A postmortem whose actions are never done gives a false sense that the problem is solved.
- Share widely, with sensitive details redacted, so lessons spread beyond the team that was paged.
From the field (placeholder, replace before publishing): How incident command or postmortem culture worked in a highly regulated environment, and one practice you would bring to any team.
6. Compare deployment strategies. Which would you use?
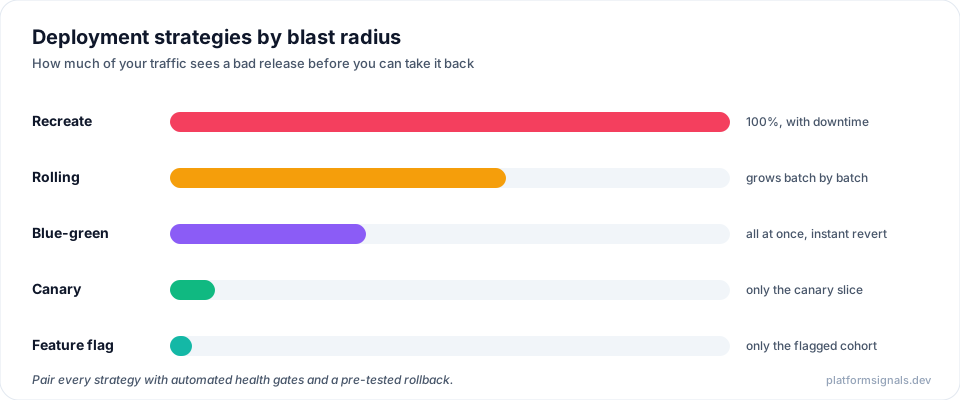
| Strategy | How it works | Rollback speed | Blast radius if bad | Extra infra cost |
|---|---|---|---|---|
| Recreate | Stop all old instances, start new ones | Slow, full redeploy | 100%, with downtime | None |
| Rolling | Replace instances in batches, gated by health checks | Moderate | Grows as the rollout progresses | None |
| Blue-green | Build a full parallel environment, switch traffic atomically | Instant, flip back | Zero before cutover, then all traffic | 2x during cutover |
| Canary | Send a small percentage of traffic to the new version, then ramp | Fast, shift back to 0% | Limited to the canary slice | Small |
| Feature flags | Ship code dark, enable per cohort without redeploying | Instant | Limited to the flagged cohort | Minimal |
When to use which
- Canary plus feature flags for anything on the critical path in a mature organisation. Finest control and fastest safe rollback.
- Blue-green when a full environment swap is cheap and you want an all-or-nothing cutover, typically stateless API tiers.
- Rolling as the pragmatic Kubernetes default when a parallel environment would be wasteful.
Whatever the strategy, the enabler is automated health gates: the rollout only advances, or automatically reverts, based on error rate and latency SLO burn during the rollout window. A bad deploy should be caught by the pipeline, not by a page.
What they are testing: that you tie the choice to blast radius and rollback speed, and that you mention automated gates rather than humans watching dashboards.
Observability and alerting
Expect depth here. Interviewers want to know whether you understand how the tools behave under load, not just which tools exist.
7. Prometheus: what is it, what breaks it, and how would you run it in production?
What it is
Prometheus is an open-source time-series monitoring and alerting system built on a pull model.
| Capability | What it gives you |
|---|---|
| Pull-based scraping | Fetches /metrics over HTTP on a fixed interval |
| Dimensional data model | A series is a metric name plus labels, e.g. http_requests_total{method="GET", code="500"} |
| PromQL | Aggregation, filtering, rates and arithmetic over time |
| Local TSDB | Compressed on-disk storage, 15 days retention by default |
| Service discovery | Kubernetes, EC2, Consul and file-based targets that update automatically |
| Recording and alerting rules | Recording rules precompute expensive queries; alerting rules fire alerts |
| Alertmanager | Routes, groups, deduplicates, inhibits and silences the alerts those rules fire |
| Exporters | node_exporter, blackbox_exporter, mysqld_exporter and others for systems that do not expose metrics natively |
| Pushgateway | For short-lived batch jobs that cannot be scraped |
Its biggest weakness: cardinality
Every unique combination of label values is a new time series. Labels with unbounded values (user IDs, request IDs, raw URL paths, IP addresses, pod names in very ephemeral environments) make the series count explode. The effects:
- Memory and CPU blow-up on the server, because every active series costs RAM in the head block.
- Slow queries, because PromQL has to touch more series.
- Compaction pressure and OOM crashes. Cardinality is one of the most common reasons Prometheus falls over in production.
- Large bills from hosted backends that charge per series or sample.
How to fix it
- Keep labels bounded. Use route templates (
/users/:id, not/users/123) and status classes, never IDs or raw error messages. - Drop at scrape time with
metric_relabel_configs, before data is ingested. - Pre-aggregate with recording rules so dashboards and alerts query small rolled-up series.
- Avoid churning labels such as container IDs; prefer stable ones like deployment or service.
- Set
sample_limit(and label limits) per scrape job, so a misbehaving target fails loudly instead of degrading the whole server. - Shard by domain and use Thanos or Mimir for scale and long-term storage, instead of one giant Prometheus.
- Monitor Prometheus itself:
prometheus_tsdb_head_seriesandscrape_samples_scrapedshow growth before it becomes an outage.
scrape_configs:
  - job_name: api
    sample_limit: 50000
    metric_relabel_configs:
      # drop a whole family of noisy debug metrics before ingestion
      - source_labels: [__name__]
        regex: "app_debug_.*"
        action: drop
      # strip unbounded labels (only safe if the remaining labels stay unique)
      - regex: "request_id|user_id"
        action: labeldrop
From the field (placeholder, replace before publishing): A cardinality incident you dealt with. Which label caused it, how you found it, and the guardrail you added.
How would you implement a production Prometheus stack?
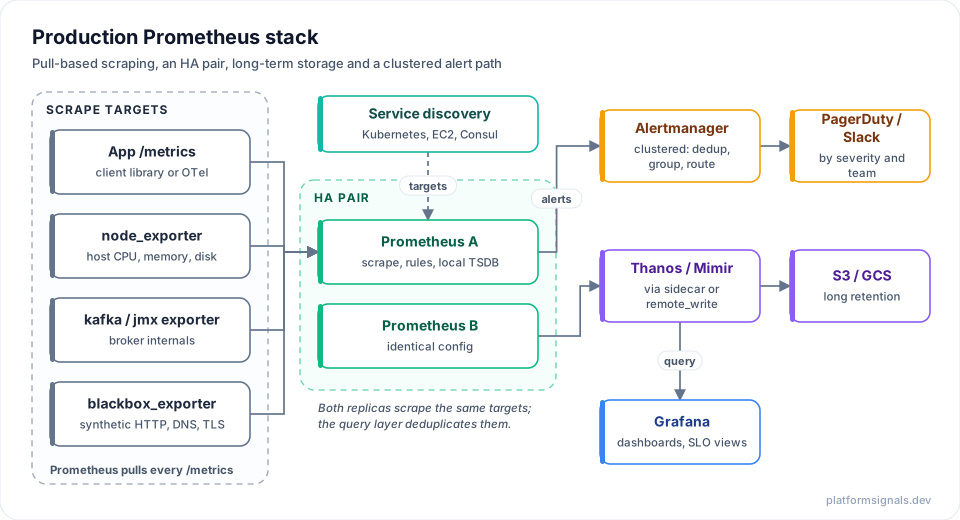
- Instrument applications with a Prometheus client library or OpenTelemetry.
- Deploy exporters for anything that is not natively instrumented.
- Use service discovery so scrape targets stay current without manual edits.
- Write recording rules for expensive queries and alerting rules for SLO burn rate and infrastructure health.
- Run Alertmanager as a cluster, with routing trees by team and severity, grouping, inhibition and silences.
- Build dashboards in Grafana, with SLO views per service.
- Run Prometheus as an HA pair scraping the same targets, and ship data to Thanos (sidecar or Receive) or Mimir (remote write) for a global view, deduplication and long retention on S3 or GCS.
- Secure it. Network policies around
/metrics, authentication in front of Alertmanager and Grafana, and no secrets in label values.
8. How would you design a reliable alerting system?
The goals: few false positives, no missed pages, no single point of failure in the alert path, and fast time to notify.
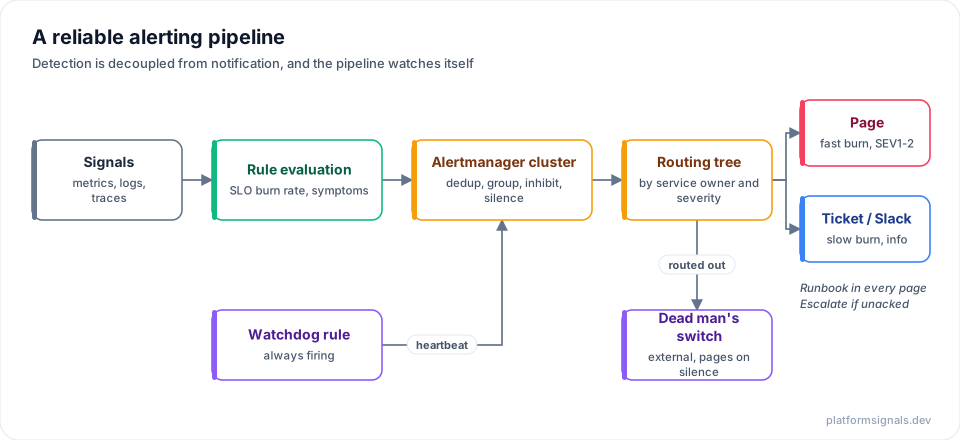
Design principles
- Decouple detection from notification. The rule engine and the paging service connect through a defined interface (webhook or API), so either can restart without losing the other’s state.
- Make the alert path highly available. Run Alertmanager as a gossip cluster. Add a dead man’s switch: an always-firing watchdog alert sent to an external service that pages you if the heartbeat stops. Otherwise a silent pipeline looks exactly like a healthy system.
- Alert on symptoms, ideally SLO burn rate, not on causes such as CPU. Every page should map to user impact.
- Use multi-window, multi-burn-rate alerts (see question 2). Fast burns page; slow burns open tickets.
- Route by ownership and escalate. If a page is not acknowledged within N minutes, escalate to a secondary.
- Deduplicate, group and inhibit. One node failure should produce one page, not forty. Inhibit downstream alerts when an upstream dependency alert is already firing.
- Link a runbook in every alert.
- Test the whole path regularly, including phone escalation. An untested alerting system is often silently broken.
Follow-up: how do you deal with alert fatigue?
| Practice | Why it works |
|---|---|
| Page only for user impact that needs action now | Everything else goes to a ticket, dashboard or channel |
| Strict severity levels | A phone call is reserved for SEV1 and SEV2 |
| Grouping and deduplication | One cause, one page |
| Burn-rate alerts instead of static thresholds | No flapping around a boundary |
| Auto-remediate known problems | A script restarts the pod; nobody is woken |
| Review pages regularly and delete noisy rules | Track “pages that needed no action” and remove or rework them |
| Rich context in the payload | Dashboard, runbook and recent deploys attached |
| Fair rotations and per-person page counts | Fatigue is an organisational problem as well as a tooling one |
From the field (placeholder, replace before publishing): A concrete before-and-after on page volume from a team you led, and the one change that made the biggest difference.
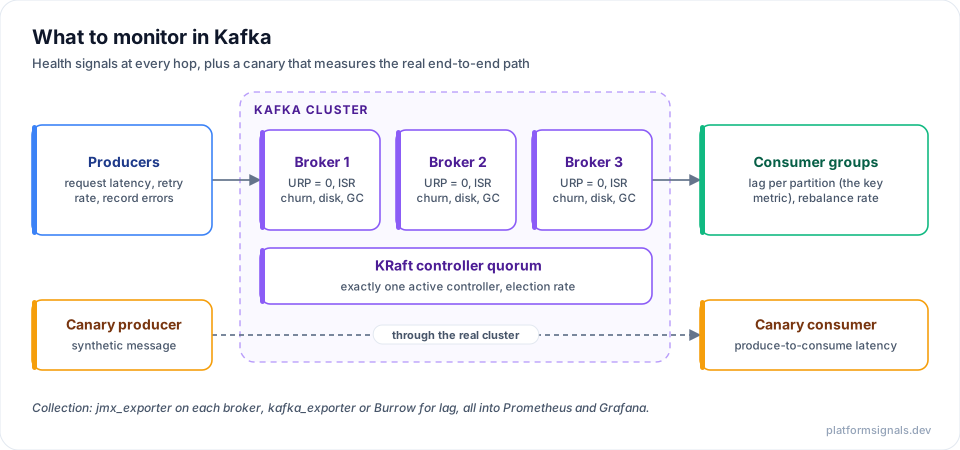
9. What would you monitor for Kafka?
| Layer | Key signals | Healthy looks like |
|---|---|---|
| Broker | Under-replicated partitions, offline partitions, active controller count, request handler idle ratio, leader election rate, ISR shrink and expand rate | URP = 0, offline = 0, exactly one active controller |
| Topic and partition | Partition skew across brokers, bytes in and out per topic, retention compliance | Even distribution |
| Consumer | Consumer lag per partition and group (the single most important signal), rebalance frequency, consume rate versus produce rate | Lag bounded and not growing |
| Producer | Request latency, retry rate, record error rate, batch size and compression ratio | Low retries and errors |
| Infrastructure | Disk usage and I/O on broker volumes, network throughput, JVM GC pauses, KRaft quorum (or ZooKeeper on older clusters) | Long GC pauses absent; they cause latency spikes and false “broker dead” detection |
| End to end | A canary producer and consumer measuring real produce-to-consume latency | Catches what per-metric dashboards miss |
Tooling: jmx_exporter on each broker for JVM internals, kafka_exporter or Burrow for lag, Cruise Control for balancing, all into Prometheus and Grafana.
10. What is your monitoring strategy for Kubernetes?
Kubernetes needs monitoring at several distinct layers, because the same user-visible symptom (say, timeouts) can start in any of them.
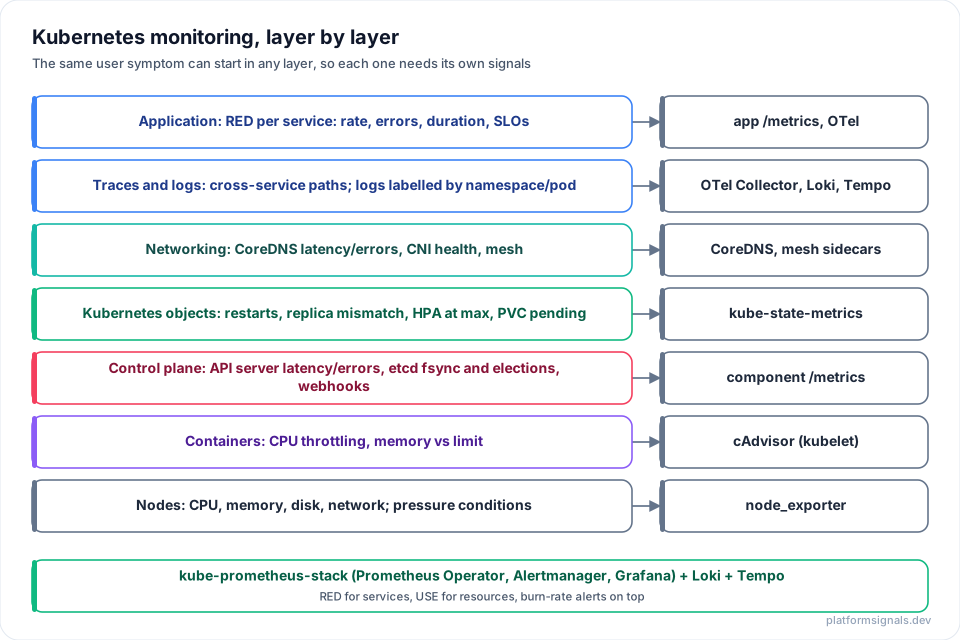
| Layer | What to watch | Typical source |
|---|---|---|
| Application | RED metrics (rate, errors, duration) and SLOs | App /metrics, OpenTelemetry |
| Traces and logs | Cross-service paths; logs labelled with namespace, pod and container | OTel Collector, Tempo or Jaeger, Fluent Bit to Loki or ELK |
| Networking | CoreDNS latency and errors, CNI health, service mesh metrics | CoreDNS, Istio or Linkerd |
| Kubernetes objects | Pod restarts, replica mismatches, HPA current versus desired, PVC binding, job failures | kube-state-metrics |
| Control plane | API server latency and errors, etcd fsync latency and leader elections, admission webhook latency | Component /metrics |
| Containers | CPU throttling, memory usage against limits | cAdvisor in the kubelet |
| Nodes | CPU, memory, disk, network, pressure conditions | node_exporter |
Standard stack: kube-prometheus-stack (Prometheus Operator, Prometheus, Alertmanager, Grafana, kube-state-metrics, node_exporter) installed with Helm, using ServiceMonitor and PodMonitor resources instead of static scrape config. Add Loki for logs with the same labels, so a Grafana panel can jump from a metric spike to the matching logs, and Tempo or Jaeger for traces.
High-value Kubernetes alerts
- Node
NotReady,DiskPressureorMemoryPressure. - Restart rate rising across a whole deployment (a bad rollout, not one flaky pod).
- PVC usage approaching capacity.
- HPA pinned at
maxReplicasfor a sustained period, a sign capacity planning has fallen behind. - API server error rate or latency, and etcd leader election frequency. Control-plane problems affect every workload, so give them their own high-priority route.
- Certificate expiry for the kubelet, control plane and webhooks.
- CoreDNS error rate. DNS failures show up as apparently random application timeouts.
Mental model: RED for every service, USE (utilisation, saturation, errors) for every resource, applied consistently at every layer.
11. How would you design observability for data pipelines?
For pipelines, the question is not just “is the job running” but “can I trust the data that landed, and did it land on time?”
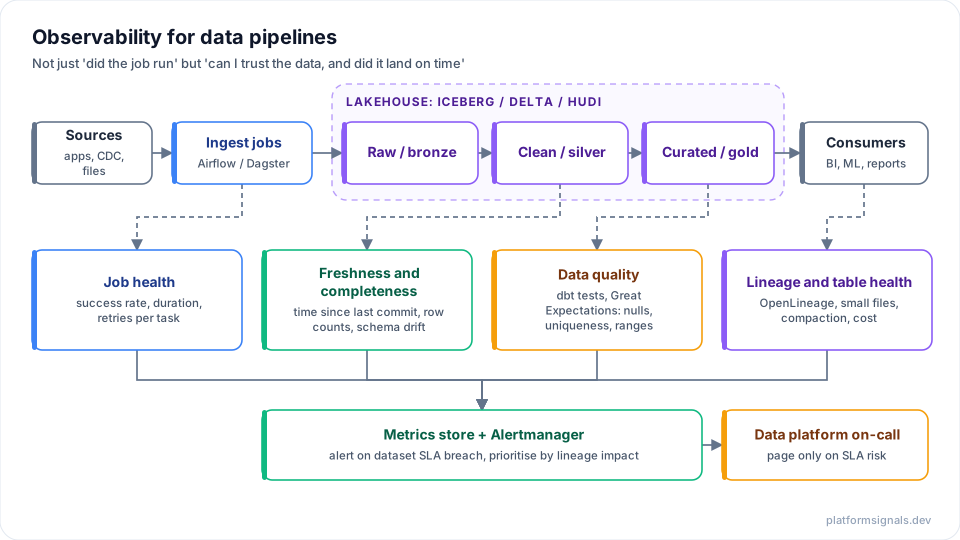
| Layer | Signals | Tools |
|---|---|---|
| Job health | Success rate, duration trend (p50 and p95), retries, failure attributed to the specific task | Airflow, Dagster or Prefect metrics |
| Freshness and completeness | Time since last successful commit per table, against a per-dataset freshness SLO; row and partition counts against a baseline; unexpected schema changes | Orchestrator plus table metadata |
| Data quality | Null rates, uniqueness, referential integrity, value ranges, published as metrics rather than log lines | dbt tests, Great Expectations, Deequ |
| Lineage and table health | Upstream and downstream dependencies; small-file growth, compaction and vacuum jobs, retention; compute cost per job | OpenLineage or Marquez, DataHub; Iceberg, Delta or Hudi metadata |
Alerting philosophy
- Alert on SLA risk (freshness, completeness, quality), not on every retried task. “Retried and recovered” belongs on a dashboard.
- Prioritise by lineage impact. A broken core table that feeds forty dashboards deserves a page; a rarely used report does not.
- Publish a health view per dataset combining freshness, completeness and quality, so consumers can answer “can I trust this table right now” without asking the platform team.
Live troubleshooting
This round is usually a scenario with an interviewer playing the system. Narrate your reasoning, ask what you would see at each step, and never jump straight to a fix.
12. How would you troubleshoot a latency issue on a Linux server?
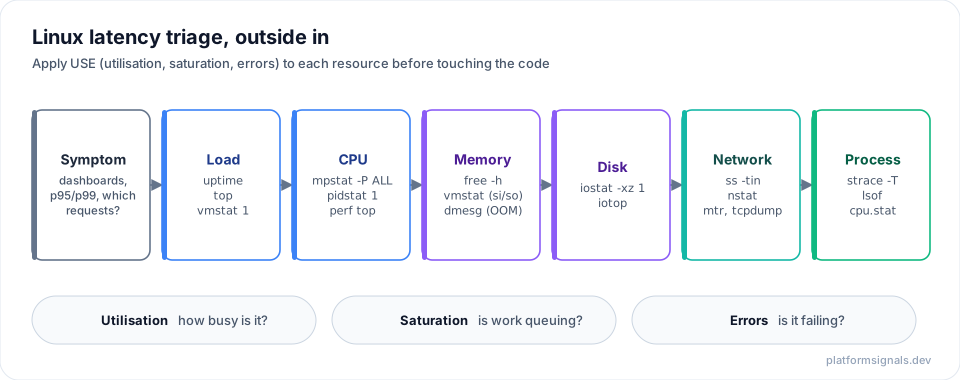
Work from the outside in, and apply Brendan Gregg’s USE method (utilisation, saturation, errors) to each resource so you are following a checklist rather than running random commands.
1. Confirm and scope the symptom. Check p50, p95 and p99 on the dashboards. Is it every request, or one endpoint, one upstream or one time window?
2. Overall load.
uptime          # load averages over 1, 5 and 15 minutes
top             # or htop
vmstat 1 5      # CPU, memory, swap and I/O at a glance
A high load average with low CPU use usually means tasks waiting on I/O (D state) or lock contention, not CPU.
3. CPU.
mpstat -P ALL 1   # per-core usage; look for one hot core
pidstat 1         # per-process CPU and I/O
perf top          # which functions are hot
4. Memory.
free -h
vmstat 1 5            # watch si/so: any swapping under load is bad
dmesg -T | grep -i oom
Swapping is a classic silent latency killer.
5. Disk.
iostat -xz 1 5   # %util near 100 and high await mean a disk bottleneck
iotop            # which process is doing the I/O
6. Network.
ss -s                                # socket summary
ss -tin state established            # per-connection RTT, retransmits, queues
nstat -az | grep -i retrans          # retransmit counters
mtr <upstream-host>                  # per-hop latency and loss
dig <hostname>                       # DNS resolution time
tcpdump -i eth0 port 443 -w cap.pcap # capture for deeper analysis
Also look for connection pool exhaustion and slow DNS.
7. The process itself.
strace -p <pid> -T -tt   # per-syscall timing: where is it blocking?
lsof -p <pid>            # open files and sockets; fd leaks
8. Limits and throttling. ulimit -n for file descriptor exhaustion. In containers, check CPU throttling in cpu.stat (nr_throttled, throttled_usec). On cgroup v2, which most current distributions and Kubernetes nodes use, it is /sys/fs/cgroup/cpu.stat; on cgroup v1 it is /sys/fs/cgroup/cpu/cpu.stat.
9. Correlate with change. A deploy, a config change, a scaling event, a flapping autoscaler or a noisy neighbour. Check journalctl and dmesg.
10. Follow one request. Distributed tracing (OpenTelemetry with Jaeger or Tempo) shows which hop, query or lock is actually adding the latency, instead of guessing from host metrics.
What they are testing: structure. A clear order, a reason for each command, and the instinct to check recent changes and tracing before blaming the host.
13. Kubernetes troubleshooting: what do these pod states mean?
| Symptom | Likely cause | How to confirm |
|---|---|---|
CrashLoopBackOff | App exits on start: bad config, missing secret or env var, failed dependency check | kubectl logs <pod> --previous shows the last crash, not the current restart |
OOMKilled | Container exceeded its memory limit | kubectl describe pod shows Last State: Terminated, Reason: OOMKilled; compare kubectl top pod with resources.limits.memory |
Pending | Not enough resources, unsatisfied affinity, taints, or an unbound PVC | kubectl describe pod events show FailedScheduling and the reason |
ImagePullBackOff / ErrImagePull | Wrong tag, missing registry credentials, egress blocked | Events; check imagePullSecrets and registry reachability from a node |
| Readiness probe failing | Slow warm-up, or a dependency is not reachable yet | Probe failure events; call the probe endpoint from inside the cluster; consider a startupProbe |
| Liveness probe killing healthy pods | Probe timeout too tight for real latency under load | Compare timeoutSeconds and periodSeconds with observed p99; loosen it or rely on readiness |
| Service returns 503, no endpoints | Selector does not match pod labels, or no pod passes readiness | kubectl get endpointslices -l kubernetes.io/service-name=<svc>; empty means nothing matches |
Node NotReady | Kubelet down, disk pressure, CNI failure | kubectl describe node and its Conditions |
General flow: kubectl get pods for status, then kubectl describe pod (the events nearly always contain the answer), then kubectl logs (with --previous for crashes), then kubectl debug or kubectl exec to test connectivity and config from inside the cluster.
14. A user cannot log in. How do you troubleshoot it?
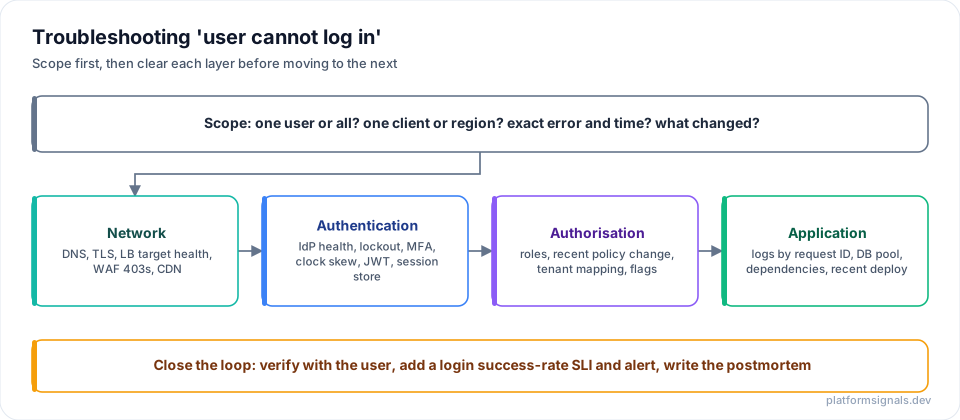
Step 1: reproduce and scope
- One user or all users? One user suggests account state (locked, expired password, MFA device). Everyone suggests a systemic problem (auth service, certificate, DNS, config).
- One client or region, or global? Points to edge or client versus backend.
- Exact error and time. Correlate with deploys and config changes.
Step 2: network
- Can the client reach the endpoint?
curl -v https://app.example.com/login,dig app.example.com,openssl s_client -connect host:443. - Are load balancer targets healthy? (
aws elbv2 describe-target-healthor the equivalent.) - Is a WAF rule, rate limit or IP block returning 403s from the edge rather than the app?
- Is the CDN caching an error response, or is there a regional edge outage?
Step 3: authentication
- Is the identity provider (Cognito, Auth0, Okta, or an internal service) healthy?
- Credential problems: expired password, lockout after failed attempts, MFA out of sync, SAML or OIDC metadata mismatch.
- Token and session problems: expired or malformed JWT, clock skew breaking validation, an unreachable session store.
- Search auth logs by user or request ID for the exact reason (
invalid_grant,account_locked,mfa_required).
Step 4: authorisation
- Authentication succeeds, but the user’s role does not grant access, a recent policy change revoked it, a feature flag gates a cohort, or the user is mapped to the wrong tenant.
Step 5: application
- Logs and traces for the login request: connection pool exhaustion, a dependency timing out, an exception in a newly deployed code path.
- Database health: replica lag causing read-after-write failures just after sign-up, lock contention on the users table.
- If a recent deploy lines up with the start time, roll it back (question 4).
Step 6: close the loop
- Verify the fix with the affected user or a synthetic account.
- Add a login success-rate SLI and alert so this fails loudly next time instead of arriving as a user report.
- Write the postmortem and turn the fix into automation or a runbook.
Mental model: network, then authentication, then authorisation, then application. Confirm each layer is healthy before moving on.
From the field (placeholder, replace before publishing): A real login or SSO incident: what the first symptom was, which layer it turned out to be, and what you would check first next time.
Coding for operations
SRE coding rounds rarely want clever algorithms. They want correct, readable, idiomatic code delivered quickly, plus the operational instincts around it: streaming instead of loading everything into memory, timezones, clocks and concurrency.
15. Write a CLI that parses and indexes access logs
What interviewers look for
argparse(orclickortyper) instead of hand-parsingsys.argv.- Streaming, line by line, including
.gzfiles, so the tool works on multi-gigabyte logs. - Structured parsing. If the logs are JSON, use
json.loadsper line; regex is the fallback for legacy formats. - Separate layers: parse, then filter and aggregate, then output or index.
- Batch writes to the index (for example the Elasticsearch or OpenSearch
_bulkAPI), not one request per document. - Idempotent and resumable: track a byte offset or last timestamp so a re-run after a crash neither duplicates nor loses data.
import argparse
import gzip
import json
import re

# Common Log Format; the size field can be "-" when no body was sent
LOG_PATTERN = re.compile(
    r'(?P<ip>\S+) \S+ \S+ \[(?P<time>[^\]]+)\] '
    r'"(?P<method>\S+) (?P<path>\S+) [^"]*" (?P<status>\d{3}) (?P<size>\d+|-)'
)


def parse_lines(path):
    opener = gzip.open if path.endswith(".gz") else open
    with opener(path, "rt", errors="replace") as f:
        for line in f:
            match = LOG_PATTERN.match(line)
            if match:
                record = match.groupdict()
                record["size"] = 0 if record["size"] == "-" else int(record["size"])
                yield record


def main():
    parser = argparse.ArgumentParser(description="Parse and filter access logs")
    parser.add_argument("logfile")
    parser.add_argument("--status", help="status prefix to keep, e.g. 4 or 5")
    args = parser.parse_args()

    for record in parse_lines(args.logfile):
        if args.status and not record["status"].startswith(args.status):
            continue
        print(json.dumps(record))  # swap for a batched _bulk writer to index


if __name__ == "__main__":
    main()
Likely follow-ups: how would you handle malformed lines (count and sample them, never crash), how would you parallelise it (split by file, not by line), and how would you avoid re-indexing on restart (persist the offset).
16. Count 404s and other errors in the last hour from a CSV
import csv
from collections import Counter
from datetime import datetime, timedelta, timezone


def parse_ts(value):
    # fromisoformat only accepts a trailing "Z" from Python 3.11
    ts = datetime.fromisoformat(value.replace("Z", "+00:00"))
    if ts.tzinfo is None:
        ts = ts.replace(tzinfo=timezone.utc)  # state this assumption out loud
    return ts


def errors_in_last_hour(csv_path, now=None):
    now = now or datetime.now(timezone.utc)
    cutoff = now - timedelta(hours=1)
    counts = Counter()

    with open(csv_path, newline="") as f:
        for row in csv.DictReader(f):
            ts = parse_ts(row["timestamp"])
            if not (cutoff <= ts <= now):
                continue
            status = int(row["status"])
            if status == 404:
                counts["404"] += 1
            elif status >= 500:
                counts["5xx"] += 1
            elif status >= 400:
                counts["4xx_other"] += 1
    return counts


if __name__ == "__main__":
    result = errors_in_last_hour("access_log.csv")
    print(f"404s in the last hour: {result['404']}")
    print(f"5xx in the last hour:  {result['5xx']}")
Points worth saying out loud
- Stream, do not load.
csv.DictReaderreads row by row. If you reach for pandas, usechunksize=on large files. - Timezones. Compare timezone-aware datetimes in UTC. Mixing naive and aware datetimes raises a
TypeError, and silently assuming local time causes off-by-an-hour bugs around daylight saving changes. - Taking
nowas a parameter makes the function deterministic and testable. - This is a forensic tool. If you need the number continuously, count at the source instead:
sum(increase(http_requests_total{code="404"}[1h]))in Prometheus, or a query in your log platform.
17. Design and implement a rate limiter
Problem: implement allow_request(client_id) -> bool that allows at most N requests per client per time window.
| Approach | Accuracy | Memory per client | Bursts | Notes |
|---|---|---|---|---|
| Fixed window counter | Allows up to 2N across a window boundary | O(1) | Uncontrolled at boundaries | Simplest |
| Sliding window log | Exact | O(N) timestamps | Prevented | Costly at high limits |
| Sliding window counter | Close approximation | O(1) | Smoothed | Weights the previous window’s count |
| Token bucket | Enforces the long-run rate | O(1) | Allowed up to capacity | What most API gateways use |
Approach 1: fixed window
import threading
import time
from collections import defaultdict


class FixedWindowLimiter:
    def __init__(self, limit, window_seconds):
        self.limit = limit
        self.window = window_seconds
        self.counts = defaultdict(int)
        self.window_start = {}
        self.lock = threading.Lock()

    def allow_request(self, client_id):
        now = time.monotonic()
        with self.lock:
            start = self.window_start.get(client_id)
            if start is None or now - start >= self.window:
                self.window_start[client_id] = now
                self.counts[client_id] = 0
            if self.counts[client_id] < self.limit:
                self.counts[client_id] += 1
                return True
            return False
The flaw to name: a client can send N requests at the end of one window and N more at the start of the next.
Approach 2: sliding window log
from collections import deque


class SlidingWindowLogLimiter:
    def __init__(self, limit, window_seconds):
        self.limit = limit
        self.window = window_seconds
        self.requests = defaultdict(deque)
        self.lock = threading.Lock()

    def allow_request(self, client_id):
        now = time.monotonic()
        with self.lock:
            q = self.requests[client_id]
            while q and now - q[0] >= self.window:
                q.popleft()
            if len(q) < self.limit:
                q.append(now)
                return True
            return False
Exact, but it stores a timestamp for every request in the window.
Approach 3: token bucket (the usual best answer)
class TokenBucketLimiter:
    def __init__(self, capacity, refill_rate):
        self.capacity = capacity
        self.refill_rate = refill_rate  # tokens per second
        self.buckets = {}               # client_id -> (tokens, last_refill)
        self.lock = threading.Lock()

    def allow_request(self, client_id):
        now = time.monotonic()
        with self.lock:
            tokens, last = self.buckets.get(client_id, (self.capacity, now))
            tokens = min(self.capacity, tokens + (now - last) * self.refill_rate)
            allowed = tokens >= 1
            if allowed:
                tokens -= 1
            self.buckets[client_id] = (tokens, now)
            return allowed
O(1) time and memory per client, and it allows controlled bursts up to capacity while enforcing the long-run rate. A leaky bucket is the mirror image: it smooths bursty input into a constant output rate.
Two details that mark you out
- Use
time.monotonic(), nottime.time(). Wall-clock time can jump backwards or forwards (NTP corrections, manual changes), which would refill a bucket instantly or lock clients out. - Make it thread-safe. A lock around the read-modify-write is the simple correct answer. Mention that idle client entries need evicting, or memory grows without bound.
Follow-up: how do you rate-limit across many gateway instances?
In-process counters let each instance allow the full limit, multiplying the real limit by the number of instances. Centralise the state in Redis and make the check atomic: INCR with EXPIRE for a fixed window, or a Lua script that implements the token bucket in a single round trip. Then discuss what happens when Redis is unavailable: fail open (protect availability) or fail closed (protect the backend), and why you would choose one for this particular API.
System design, infrastructure and security
The last round is the most open-ended. Clarify requirements and constraints first, sketch the architecture, then go deep on failure modes, because that is what an SRE system design interview is really about.
18. How do you build resilience and reliability in the cloud?
| Principle | In practice |
|---|---|
| No single points of failure | Multi-AZ by default, multi-region where the business case justifies it |
| Redundancy with automatic failover | Health-checked load balancers, Multi-AZ managed databases, active-active or active-passive pairs |
| Graceful degradation | Serve cached or stale data, or switch off a non-critical feature, instead of failing hard |
| Timeouts, retries with backoff and jitter, circuit breakers | On every network call, so one slow dependency cannot exhaust threads upstream. Retry storms are a leading cause of cascading outages; use retry budgets |
| Bulkheads | Separate connection pools, thread pools or clusters per dependency or tenant |
| Idempotency | Idempotency keys on writes so retries are safe |
| Autoscaling on real signals | Queue depth, latency or CPU, with sane bounds, plus pre-scaling for known peaks |
| Infrastructure as code | Rebuild from code rather than hoping a snapshot works |
| Tested backups | Regular restore drills against explicit RPO and RTO targets. An untested backup is not a backup |
| Chaos engineering | Controlled failure injection (AWS FIS, Gremlin, Chaos Mesh) to prove the mechanisms work |
| Blast-radius reduction | Canaries, feature flags, cell-based architecture, region-by-region rollouts |
| Observability | Metrics, logs, traces and SLO dashboards underpin everything above |
19. Horizontal versus vertical scaling
| Vertical (scale up) | Horizontal (scale out) | |
|---|---|---|
| How | Bigger CPU, memory or disk on one node | More nodes running the same workload |
| Ceiling | The largest instance type | Bounded by architecture, not hardware |
| Downtime | Often needs a restart to resize | Usually none: add nodes behind a load balancer |
| Fault tolerance | Still a single point of failure | Losing one node is not an outage |
| Cost curve | The largest instances are disproportionately expensive | Roughly linear with load |
| Complexity | No architecture change | Needs statelessness, or sharding and replication for state |
| Good fit | Monoliths, a single-writer database (at first) | Stateless web and API tiers, microservices, distributed stores |
Most cloud-native systems scale stateless tiers horizontally and scale stateful components (such as a primary database) vertically until they are sharded or replicated. Mature architectures use both.
20. How would you build a scalable architecture on AWS?
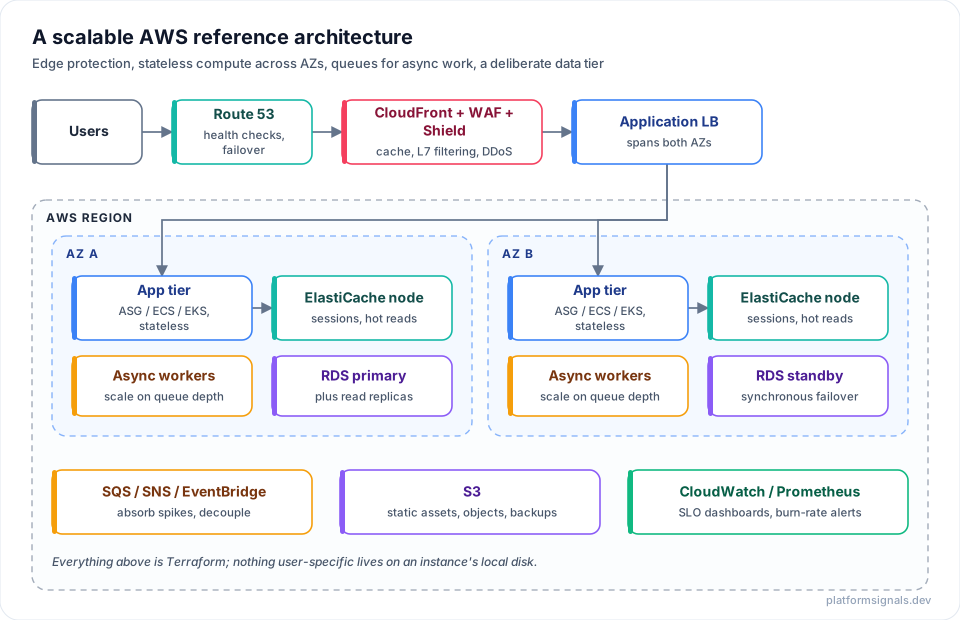
- Stateless compute, scaled horizontally. App servers in an Auto Scaling group, ECS or EKS behind an ALB across at least two AZs. Nothing user-specific on local disk.
- Shared state outside the app tier. Sessions in ElastiCache or a database, so any instance can serve any request.
- Scale on real signals. Target tracking on CPU, request count or queue depth, scheduled scaling for known peaks, and sensible minimums and maximums.
- Queues for anything that does not need an immediate answer. SQS, SNS or EventBridge for image processing, email and reports, so spikes are absorbed and workers scale independently.
- Cache at every layer. CloudFront at the edge, ElastiCache for hot reads, and correct HTTP cache headers.
- Scale the data tier deliberately. It is usually the real bottleneck. RDS Multi-AZ for availability plus read replicas for read-heavy work, or DynamoDB for very high scale with predictable access patterns. Shard when a single primary can no longer keep up.
- Multi-AZ by default, multi-region when justified. Route 53 health checks and failover routing, or active-active with DynamoDB Global Tables or Aurora Global Database.
- Protect the edge. CloudFront, WAF and Shield reduce what ever reaches the origin.
- Everything in Terraform, scaling policies included.
- Load test regularly to find the real breaking point of every tier before customers do.
21. Terraform: where is state stored, and what goes wrong across multiple accounts?
Where state lives
By default Terraform writes terraform.tfstate, a JSON file mapping your configuration to real resource IDs, in the working directory. That is fine for experiments but wrong for teams:
- No locking, so two concurrent applies can corrupt state.
- No shared source of truth.
- State often contains secrets in plain text (a database password set as an attribute), so the file itself must be protected.
Teams use a remote backend: S3, HCP Terraform (formerly Terraform Cloud), Azure Storage, GCS or Consul. On AWS the standard is now S3 with native lock files. Since Terraform 1.11, use_lockfile = true handles locking in the bucket itself, and the older DynamoDB table approach is deprecated.
terraform {
  backend "s3" {
    bucket       = "acme-tfstate-prod"
    key          = "network/terraform.tfstate"
    region       = "eu-west-2"
    encrypt      = true
    kms_key_id   = "alias/tfstate"
    use_lockfile = true   # native S3 locking; replaces dynamodb_table
  }
}
A good backend gives you locking, versioning (S3 bucket versioning so a bad state write can be rolled back), encryption and tight access control, and isolation: separate state per environment and per logical component, so a mistake in one cannot touch another.
What goes wrong across multiple AWS accounts
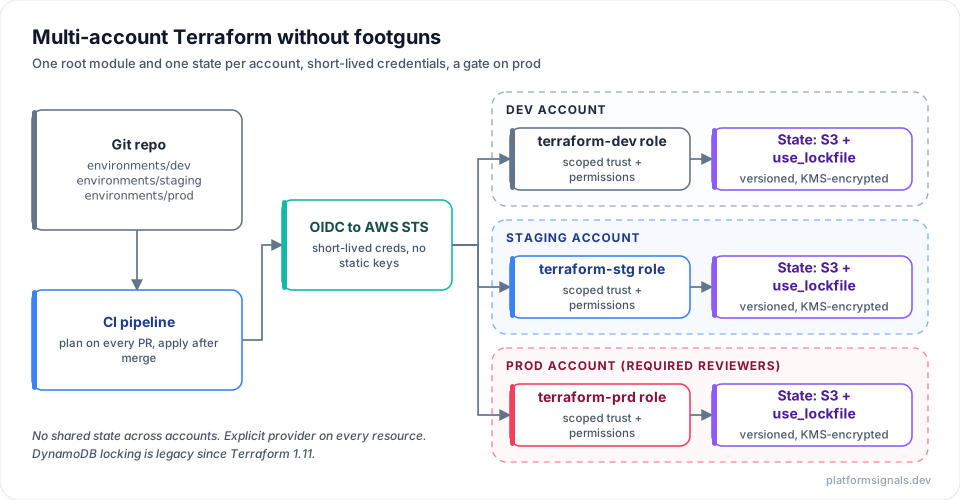
| Failure mode | What happens | Mitigation |
|---|---|---|
| Provider alias mix-up | A resource references the wrong provider "aws" alias and is created or destroyed in the wrong account | Explicit provider = aws.prod on every resource and module; better, separate root modules per account |
| Shared state across accounts | A destroy or bad plan in one environment touches another account’s resources | One state file, ideally one backend, per account and environment |
| Role assumption drift | Stale trust policies or wrong role ARNs make applies fail, or succeed against the wrong account | OIDC federation with tightly scoped roles per account; validate the account ID in the provider (allowed_account_ids) |
| Name collisions | Globally unique names (S3 buckets) collide, or hard-coded ARNs point at another account | Account-scoped naming conventions; no hard-coded ARNs |
| Partial applies | A failure midway leaves accounts in a mix of old and new, because applies are not transactional | Small, isolated root modules; one account per apply |
| Drift | Console changes in one account make environments diverge | Scheduled terraform plan drift detection; a manual approval gate for production |
Best practice in short: a directory and state per account and environment (environments/dev, environments/prod), explicit providers, OIDC instead of static keys, plan on every pull request, a protected production environment with required reviewers, and wrappers such as Terragrunt or Atlantis only once plain directories become unwieldy.
From the field (placeholder, replace before publishing): A multi-account or multi-environment Terraform near miss you saw or prevented, and the guardrail that came out of it.
Follow-up: Ansible versus Terraform
| Terraform | Ansible | |
|---|---|---|
| Purpose | Provisioning infrastructure | Configuring hosts and deploying software onto them |
| Model | Declarative, with state and a computed plan | Ordered tasks in playbooks; no persistent state |
| Idempotency | Enforced by providers comparing state with reality | Per module; depends on module authors |
| Connection | Cloud provider APIs | SSH or WinRM, agentless |
| Drift detection | terraform plan | Check mode only; no built-in drift report |
| Typical scope | VPCs, load balancers, databases, IAM, clusters | OS packages, files, services, app deployment |
They are complementary: Terraform creates the instance or cluster, then Ansible, cloud-init or a pre-baked image configures it. Many modern stacks remove the Ansible step altogether with immutable images built in CI, which reduces configuration drift further.
22. Design a configuration management and deployment platform for 200+ services
The prompt: 200+ services across several data centres and cloud regions. Config is fragmented: some in source-controlled property files, some in hand-set environment variables, some on a shared NFS mount that operators edit directly. Deploys happen by SSH-ing into hosts and running scripts. Design a platform that makes config changes safe, deploys across the fleet, removes direct host access and rolls back reliably.
Name what is wrong before designing
- No single source of truth. Property files, environment variables and the NFS mount can disagree, and nothing decides which wins.
- No review or audit. Anyone with host access can change live behaviour with no pull request and no approver.
- No versioning or atomicity. An NFS edit takes effect immediately and inconsistently, with no coordinated rollout and no previous version to return to.
- Manual SSH deploys. Unrepeatable, dependent on individual access and memory, and exactly the toil and blast-radius risk the platform should remove.
Target architecture
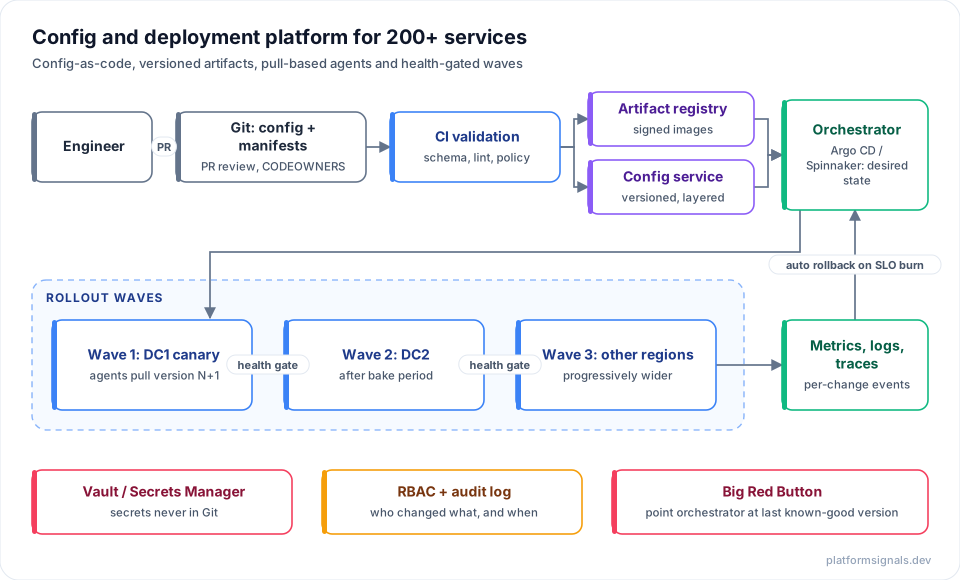
- Config as code, one source of truth. All non-secret config in Git (or a config service backed by it), reviewed through pull requests. Retire the writable NFS mount; it is the largest source of untracked drift.
- Separate secrets. Vault or AWS Secrets Manager with their own access control, rotation and audit. Never in the config repo, never on a shared mount.
- Layered, deterministic resolution. Global defaults, then region or data centre overrides, then service overrides, then instance overrides if they must exist. “Which value applies here” is always answerable from the layers.
- Versioned, atomic delivery. Each change is a new immutable version. A rollout is “move from version N to N+1”, not an in-place edit picked up at different times.
- Pull, not push. An agent on each host or cluster reconciles to the declared desired state, the same model as the kubelet and the API server. Engineers no longer SSH in for routine deploys, and it scales to many data centres without the orchestrator needing inbound access everywhere.
- Staged, health-gated waves. One data centre or region at a time, with a bake period and automated checks on error rate and latency SLO burn before progressing.
- Uniform rollback. Config and code are both versioned artifacts, so rollback is the same single action for either: point the orchestrator at the last known-good version. This is a literal Big Red Button.
- RBAC and audit everywhere. Who can approve, who can trigger a production rollout, and a log of who changed what and when. This replaces “SSH access means you can change anything”.
- Change events in observability. Every config change and deploy is annotated on dashboards, so regressions can be tied to a specific change in minutes.
Migration plan: this is brownfield
A big-bang cutover of 200+ services is itself an availability risk, so migrate in waves:
- Inventory where each service’s config lives today and who owns it.
- Run the new platform alongside the old one.
- Build one-way importers from property files, environment variables and NFS into the new repo, so parity can be checked automatically.
- Migrate low-risk services first, validate config parity, deploy and rollback end to end, then widen.
- Lock down old paths as each service moves (make its NFS paths read-only, then remove them), rather than leaving both live.
- Decommission NFS and standing SSH deploy access only once every service has moved.
What they are testing: that you diagnose before designing, separate secrets from config, choose pull over push with reasons, and have a credible migration plan rather than a greenfield fantasy.
23. Capacity planning and disaster recovery (RTO and RPO)
Capacity planning
- Baseline from peaks, not averages, then project forward a quarter or two using real growth rates.
- Keep headroom. Run at a deliberate ceiling (often 60% to 70% of capacity at normal peak) so a spike or a lost node does not cause degradation while autoscaling catches up.
- Load test every tier, including the database, cache and queue. The bottleneck is rarely where you first assume.
- Pre-scale for known events such as launches, campaigns and seasonal peaks. Autoscaling has lag: boot time, cache warm-up and connection pool ramp-up.
- Plan cost alongside capacity: right-sizing, and a sensible mix of on-demand, reserved or savings plans, and spot.
Disaster recovery
- RTO (recovery time objective): how long the system may be down. It drives failover design: a 5-minute RTO needs automation; a 4-hour RTO can tolerate a runbook.
- RPO (recovery point objective): how much data you may lose, measured in time. A 15-minute RPO means backups or replication at least that often.
- Set both per system from business impact. A payments ledger may need an RPO close to zero (synchronous replication); an analytics warehouse may accept a day.
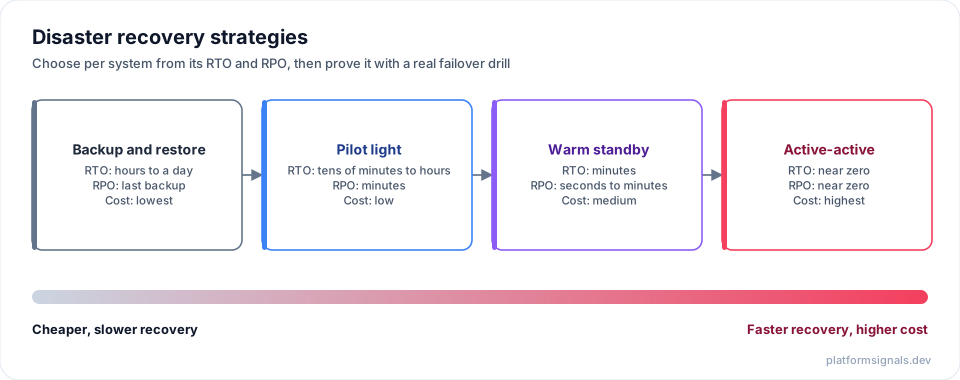
| Strategy | What runs in the recovery site | Typical RTO | Typical RPO | Cost |
|---|---|---|---|---|
| Backup and restore | Nothing; restore from backups | Hours to a day | Last backup | Lowest |
| Pilot light | Core data replicated, compute off | Tens of minutes to hours | Minutes | Low |
| Warm standby | A scaled-down but working copy | Minutes | Seconds to minutes | Medium |
| Active-active | Full capacity in several regions | Near zero | Near zero | Highest |
Test the recovery, not just the backup. An RTO is only real once you have failed over in a drill and timed it.
24. Explain the CAP theorem and consistency models
CAP: when a network partition happens, a distributed system must choose between:
- Consistency (C): every read sees the latest write, or gets an error.
- Availability (A): every request gets a non-error response, possibly with stale data.
Partitions are unavoidable in real networks, so partition tolerance is not optional, and the real choice during a partition is CP or AP. When there is no partition, the PACELC extension describes the everyday trade-off: latency versus consistency. Mentioning it shows you know CAP only describes the failure case.
| Behaviour during a partition | Examples | Good for | |
|---|---|---|---|
| CP | Rejects or blocks some requests to stay correct | etcd, ZooKeeper, single-primary databases with synchronous replication | Coordination, leader election, ledgers |
| AP | Keeps answering, possibly with stale data | Cassandra, DynamoDB with eventually consistent reads, CouchDB | Carts, feeds, caches, sessions |
Many real systems are tunable rather than fixed: DynamoDB offers strongly consistent reads, and Cassandra lets you choose a consistency level per query.
Consistency models
| Model | Guarantee | Cost |
|---|---|---|
| Strong (linearisable) | Reads always reflect the latest acknowledged write | Latency and availability; quorum or single-leader routing |
| Causal | Causally related operations are seen in order by everyone | Moderate; suits collaboration and social apps |
| Read-your-writes | A client always sees its own writes | Cheap; route a session’s reads to where it wrote |
| Eventual | Replicas converge with no time bound | Cheapest and most available; the app must tolerate staleness |
In an interview, tie the choice to the business requirement: a ledger or lock service is CP (an error beats a wrong balance or two leaders); a likes counter or product catalogue is AP (a slightly stale number beats an error page).
25. Load balancing algorithms, and L4 versus L7
Algorithms
| Algorithm | How it works | Use when |
|---|---|---|
| Round robin | Each backend in turn | Backends and requests are roughly equal |
| Weighted round robin | Proportional to backend capacity | Mixed instance sizes |
| Least connections | Fewest active connections wins | Request duration varies a lot |
| Consistent hashing | A key (client, session, cache key) maps to the same backend; adding or removing a backend moves only a small share of keys, unlike hash % N | Sticky sessions, cache tiers |
| Power of two choices | Pick two at random, send to the less loaded | Near-optimal balance without global state |
L4 versus L7
| L4 (transport) | L7 (application) | |
|---|---|---|
| Sees | IP addresses and TCP or UDP ports | HTTP method, path, headers, cookies |
| Routing | Per connection | Per request: path, host, header, cookie |
| Overhead | Lower | Higher, must parse the protocol |
| TLS | Often passthrough, though NLB can terminate | Usually terminated at the load balancer |
| AWS | Network Load Balancer | Application Load Balancer |
| Good fit | Raw TCP or UDP, very high throughput, preserving client IP | Path-based routing to microservices, A/B by header, WAF integration |
A common edge pattern layers both: L4 or anycast in front to absorb connections and DDoS, with L7 load balancers or ingress controllers behind doing path-based routing.
26. Distributed locking and leader election
Why you need it: several instances of a service must make sure only one of them performs an action at a time, such as running a scheduled job or acting as the leader that issues writes.
Approaches
| Approach | How | Trade-off |
|---|---|---|
| Database lock | A row with a unique key and a lease expiry, taken with INSERT ... ON CONFLICT DO NOTHING or a conditional UPDATE | Simple if you already have a consistent database; locking is only as available as the database |
| Redis lock | SET key value NX PX <ttl> | Fast and common, but a single Redis node is not safe under failover. Redlock (a majority across independent nodes) helps, but Martin Kleppmann’s critique of its timing assumptions is worth citing |
| etcd, ZooKeeper or Consul | Consensus-backed (Raft or ZAB) sessions and ephemeral keys | Correct by construction; Kubernetes uses etcd-backed leases for its own leader election |
Properties a correct lock needs
- Mutual exclusion. Only one holder at a time.
- Leases. The lock expires if its holder dies, so it cannot be held forever. The catch: a holder that is merely paused (a long GC pause, say) may still be working after its lease has expired and someone else has taken the lock.
- Fencing tokens. The fix for that catch. Every acquisition returns a monotonically increasing token, and the storage layer rejects writes carrying an older token than one it has already seen. Even if two clients briefly believe they hold the lock, only the newer one’s writes land.
Leader election
Leader election is a specific use of this: one node is elected to make authoritative decisions while followers stand by. In Raft, a candidate needs votes from a majority, which prevents split brain as long as a quorum is reachable. A minority partition cannot elect its own leader.
27. Message queues: at-least-once versus exactly-once
| Guarantee | Meaning | Typical use |
|---|---|---|
| At-most-once | May be lost, never redelivered | Best-effort telemetry |
| At-least-once | Never lost, but may be delivered more than once (a consumer crashes after processing but before acknowledging) | The common default: SQS standard queues, most Kafka consumers |
| Exactly-once | Processed once, no loss, no duplicates | Only within bounded scopes, such as Kafka transactions in a Kafka-to-Kafka pipeline |
Why exactly-once is usually a half-truth: once a consumer has external side effects (writing to a database, calling a payment API), it can always crash between doing the work and acknowledging it. The achievable target is at-least-once delivery plus idempotent processing, which behaves like exactly-once from the application’s point of view.
- Idempotency keys. Each message carries a unique ID; the consumer records processed IDs in the same transaction as the side effect, or in a dedupe store, and skips repeats.
- Idempotent operations. “Set balance to X” or a conditional update (
UPDATE ... WHERE version = N) makes a duplicate a no-op. - The outbox pattern. Write the outgoing message to an outbox table in the same transaction as the business change; a relay publishes from the table. This avoids the dual-write problem where the database commit succeeds but the publish fails, or the reverse.
Dead-letter queues. After a bounded number of retries, move a poison message to a DLQ so it cannot block the queue or partition, and alert on DLQ depth: a growing DLQ usually means a bad deploy, not one bad record.
| Kafka | SQS-style queues | |
|---|---|---|
| Model | Distributed, replayable log; consumers track their own offsets | Messages removed once acknowledged |
| Replay | Yes | No |
| Many independent readers | Yes, via consumer groups | Fan out with SNS first |
| Best for | Streaming, event sourcing, many consumers of the same data | Work queues: one unit of work done once |
28. How would you implement platform SRE?
Platform SRE applies SRE practice to the internal developer platform itself: CI/CD, the Kubernetes platform, shared tooling and provisioning. The customers are other engineering teams, and the product is how easy and safe it is to ship and run a service.
- Treat the platform as a product. Know your internal customers, gather their pain points and run a roadmap, not just a ticket queue.
- Golden paths. Opinionated, supported templates (a starter repo with CI/CD, a standard Helm chart, observability already wired in) so teams get reliability, security and observability by default.
- Self-service with guardrails. A developer portal such as Backstage, or a thin API over Terraform modules, with policy enforced automatically (OPA Gatekeeper or Kyverno, mandatory scanning, cost tagging).
- SLOs for the platform. CI success rate and p95 duration, time to provision a new service, portal and internal API availability.
- Automate recurring requests. Platform toil scales with the number of teams, not one service’s traffic: scaffolding, rotation, access requests, routine scaling.
- Multi-tenancy and isolation. Namespaces, quotas, network policies and separate node pools or clusters where justified, so one team’s workload cannot starve another’s.
- Centralised observability as a platform capability every service gets for free.
- Policy as code over manual review, so governance scales with adoption.
- Measure outcomes. Golden-path adoption, developer satisfaction surveys, and DORA metrics (deployment frequency, lead time, change failure rate, time to restore) across teams.
- An on-call rotation and Big Red Buttons for the platform. A broken shared module, template or CI system stops every team at once.
Where to start: centralised observability and a CI/CD golden path first (every team benefits immediately), then self-service provisioning with guardrails, then platform SLOs, then automate the highest-volume requests based on real ticket data.
29. What security would you add to a CI/CD pipeline?
A pipeline runs arbitrary code with privileged access to cloud credentials, signing keys and production. Treat it as a high-value security boundary.
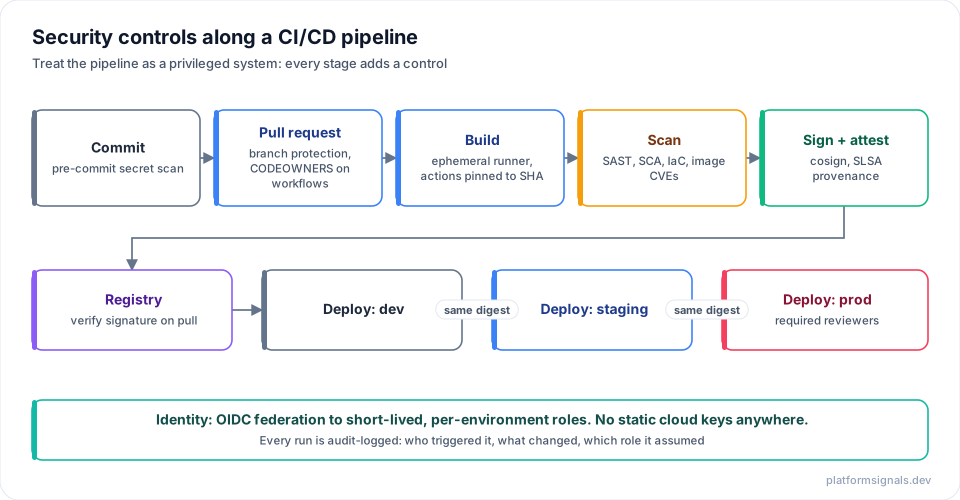
| Area | Controls |
|---|---|
| Identity and secrets | OIDC federation (for example GitHub Actions assuming an AWS role) instead of static keys; least-privilege roles per environment; secret scanning on every push plus pre-commit hooks (gitleaks, TruffleHog); a secrets manager for runtime secrets, never plaintext in workflow files |
| Supply chain | Pin third-party actions to a full commit SHA, not a mutable tag; dependency scanning with Dependabot or Renovate and committed lockfiles; SAST (CodeQL, Semgrep, Bandit) and IaC scanning (Checkov, Trivy config); image scanning with Trivy or Grype at build time and continuously afterwards; signing and provenance with Sigstore cosign and SLSA attestations |
| Pipeline hygiene | Workflow files protected by CODEOWNERS and review; never run untrusted fork code with secrets (avoid pull_request_target for that); ephemeral runners rather than long-lived shared self-hosted ones; branch protection with required checks and reviews |
| Deployment | Build once and promote the same digest through every environment; a protected production environment with required reviewers; full audit logs of who triggered what, with which role |
What they are testing: whether you see the pipeline itself as an attack surface (pinned actions, untrusted triggers, runner isolation), not just a place to bolt on scanners.
30. What security monitoring would you set up for a website?
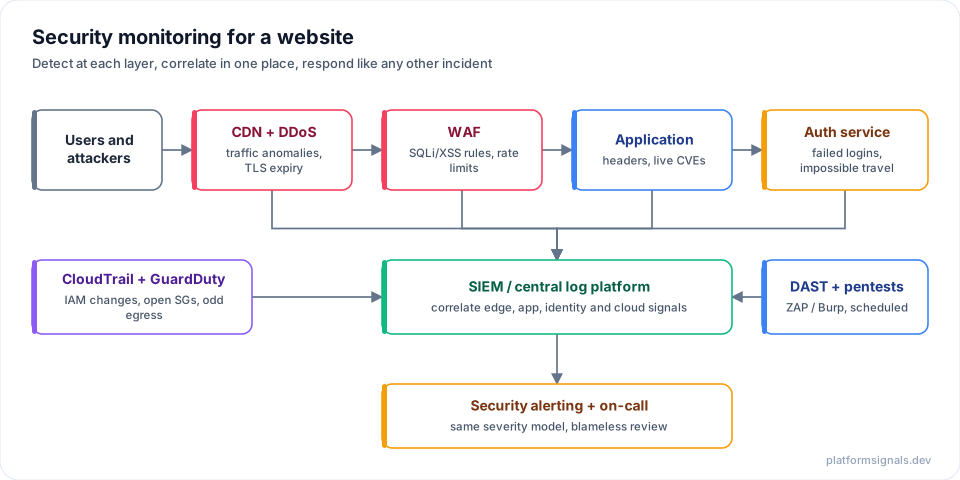
| Layer | What to monitor |
|---|---|
| Edge and network | DDoS and traffic anomalies; WAF blocks for SQL injection, XSS and path traversal; rate limiting against brute force, credential stuffing and scraping; certificate expiry and unexpected certificate changes; TLS versions and ciphers |
| Application | Security headers (CSP, HSTS, X-Content-Type-Options, Referrer-Policy, frame protection) checked after every deploy; continuous CVE scanning of deployed dependencies; scheduled DAST (OWASP ZAP, Burp) and periodic penetration tests; regular review of WAF logs for false positives and misses |
| Identity | Failed logins per account and per source IP; impossible travel and new-device logins; MFA failure spikes; session tokens reused from very different IPs |
| Cloud and infrastructure | CloudTrail, GuardDuty and Security Hub for console logins without MFA, security groups opened to 0.0.0.0/0, broad new IAM permissions, dormant keys suddenly used; file integrity monitoring on non-immutable hosts; unusual outbound traffic, often the first sign of a compromised host |
Tie it together in a SIEM (Splunk, Elastic Security, Datadog Cloud SIEM or Security Hub). One failed-login spike is noise; the same spike alongside a new IAM policy and unusual egress is an incident. Route security alerts through the same disciplined pipeline as operational ones (question 8): severities, a security on-call and blameless reviews.
Quick-reference cheat sheet
| # | Topic | One-line answer |
|---|---|---|
| 1 | SLI, SLO, SLA | SLI measures (good / valid events), SLO targets internally, SLA promises externally and is looser |
| 1 | Error budget | 1 - SLO; 99.5% over 30 days is 3.6 hours to spend on risk |
| 2 | SLOs from a 95% SLA | Start from user happiness, clear the SLA with margin, account for dependencies, alert on burn rate |
| 2 | Burn-rate alerts | Page at 14.4x (1h/5m) and 6x (6h/30m); ticket at 1x (3d/6h) |
| 3 | Toil | Manual, repetitive, automatable, tactical, no enduring value, scales O(n); keep under 50% |
| 4 | Big Red Button | One pre-tested, independent, idempotent action back to known-good |
| 5 | Incidents | Severity up front, an Incident Commander, mitigate first, blameless postmortem with tracked actions |
| 6 | Deploy strategy | Canary plus feature flags, gated by automated SLO checks |
| 7 | Prometheus | Pull-based scraping, labels, PromQL, recording and alerting rules, Alertmanager |
| 7 | Prometheus’s biggest issue | Cardinality from unbounded labels; fix with bounded labels, relabelling, recording rules, sample_limit, sharding |
| 8 | Reliable alerting | Clustered Alertmanager, dead man’s switch, symptom-based burn-rate alerts, runbooks, tested end to end |
| 8 | Alert fatigue | Page only on actionable user impact; group, dedupe, auto-remediate, prune |
| 9 | Kafka | Consumer lag and under-replicated partitions first; one active controller; canary for end to end |
| 10 | Kubernetes monitoring | kube-prometheus-stack; RED for services, USE for resources; watch control plane, CoreDNS, certificates |
| 11 | Data pipelines | Freshness, completeness, quality and lineage, not just job success; prioritise alerts by lineage |
| 12 | Linux latency | Symptom, load, CPU, memory, disk, network, process, limits, recent changes, tracing |
| 13 | CrashLoopBackOff / OOMKilled | kubectl logs --previous; describe pod for the termination reason |
| 14 | Login troubleshooting | Scope, then network, authentication, authorisation, application |
| 15 | Log CLI | argparse, stream line by line, separate parse, filter and output, batch writes, resumable |
| 16 | Errors in last hour | Stream the CSV, timezone-aware UTC comparisons, now as a parameter |
| 17 | Rate limiter | Token bucket, time.monotonic(), a lock; Redis plus Lua when distributed |
| 18 | Cloud resilience | Multi-AZ, timeouts with backoff and jitter, circuit breakers, bulkheads, tested restores, chaos |
| 19 | Horizontal vs vertical | Add nodes (elastic, fault tolerant) vs a bigger node (simple, capped) |
| 20 | Scalable AWS | Edge (CloudFront, WAF), stateless compute across AZs, cache, queues, Multi-AZ data tier |
| 21 | Terraform state | Remote S3 backend with use_lockfile (DynamoDB locking deprecated), versioned and encrypted |
| 21 | Multi-account Terraform | One state per account, explicit providers, OIDC roles, gated prod |
| 21 | Ansible vs Terraform | Terraform provisions (declarative, stateful); Ansible configures (task-based, no state) |
| 22 | Config platform | Git as source of truth, secrets separate, versioned config, pull-based agents, gated waves, wave-by-wave migration |
| 23 | RTO / RPO | RTO is downtime allowed, RPO is data loss allowed; choose a DR strategy per system and drill it |
| 24 | CAP | During a partition choose C or A; PACELC adds latency versus consistency the rest of the time |
| 25 | L4 vs L7 | L4 routes connections by IP and port; L7 routes requests by path, host, header or cookie |
| 26 | Distributed locks | Leases plus fencing tokens; consensus systems (etcd, ZooKeeper) when correctness matters |
| 27 | Exactly-once | At-least-once delivery plus idempotent processing; outbox pattern; alert on DLQ depth |
| 28 | Platform SRE | Platform as a product, golden paths, self-service with guardrails, platform SLOs, DORA |
| 29 | CI/CD security | OIDC not static keys, SHA-pinned actions, scanning, signed artifacts, build once and promote |
| 30 | Website security | Edge, app, identity and cloud signals correlated in a SIEM, handled like any incident |
Final thought
The candidates who do well in these loops are rarely the ones who know the most tools. They are the ones who keep coming back to the same few ideas in every round: measure what users feel, spend risk deliberately, make recovery fast and boring, and automate anything you have to do twice.
If you want to go deeper on those ideas, from SLO design and observability through to automation and AI-assisted operations, I cover them end to end in my book, The Autonomous SRE Playbook: Building Reliable Systems with Observability, Automation, and AI.
Good luck with your loop.
Comments 0