If you’ve worked in SRE for any length of time, the four golden signals are muscle memory: latency, traffic, errors, saturation. They’ve been the operational compass for distributed systems since Google’s SRE book made them canon. Point a dashboard at those four, and you can usually tell whether a service is healthy, struggling, or already on fire.
Then GenAI showed up, and the dashboard stopped making sense.
The instinct from many platform teams has been to bolt on “AI observability” as a separate discipline — a new tool, a new vocabulary, a new team. I think that’s the wrong move. The golden signals haven’t become obsolete; they’ve become more nuanced. Every signal still applies. It’s the definition of each one that needs translation.
This article is that translation. If you’re an SRE or platform engineer being asked to take operational ownership of an LLM-powered service, this is the mental model I’d start with.
Why AI workloads break the old definitions
Before we map signal by signal, it helps to be explicit about why the classical definitions fall short.
A traditional web service has a fairly predictable cost-per-request: a few milliseconds of CPU, a database round-trip, some bytes over the wire. Two requests with the same endpoint and similar payloads will look almost identical at the infrastructure layer.
An LLM request is not like that. Two requests to the same /v1/chat/completions endpoint can differ by two orders of magnitude in cost, latency, and resource consumption — based purely on the input and output token counts. A 50-token summarisation and a 4,000-token document analysis hit the same endpoint, return the same HTTP 200, and yet behave like entirely different workloads.
On top of that, LLM systems introduce a category of failure that doesn’t exist in traditional services: the request succeeds, the response parses, the user gets an answer, and the answer is wrong. There’s no 5xx for hallucination. No stack trace for drift. The system is, by every traditional metric, healthy — while quietly producing nonsense.
This is the gap the golden signals need to close.
Latency: from milliseconds to streaming experience
In a traditional service, latency is a single number: time-to-response, usually measured at p50, p95, and p99. A REST endpoint either returns in 200ms or it doesn’t.
LLMs don’t fit that model because the response streams. The user is waiting for two distinct things:
- Time to First Token (TTFT) — how long before anything appears on screen. This is the perceived responsiveness of the system. A 3-second TTFT feels broken even if the full response is excellent.
- Inter-Token Latency (ITL) — the gap between subsequent tokens, which determines whether the response feels fluent or stutters.
- Total inference time — the end-to-end completion duration, which only matters for non-streaming use cases or downstream automation.
For SREs, this means your latency SLOs need to split. A single “p95 response time” metric is hiding the experience entirely. I’ve seen teams celebrate a stable p95 while users were complaining about UX, because TTFT had quietly regressed from 400ms to 1.8s — the totals looked fine because output tokens compensated.
A practical SLO structure looks more like: “p95 TTFT under 800ms, p95 ITL under 80ms, for prompts up to N input tokens.” That last clause matters. Latency in LLM-land is input-size dependent, so SLOs need to be bucketed by prompt size or they’ll mislead you.
Traffic: from requests-per-second to tokens-per-second
RPS is still measurable, and you should still measure it. But for LLM workloads, RPS is a poor proxy for actual load. Ten requests with 8,000-token prompts will saturate a GPU long before a thousand requests with 50-token prompts will.
The honest unit of demand is the token. Specifically:
- Input tokens per second (TPS-in) — drives prefill cost, which is compute-bound.
- Output tokens per second (TPS-out) — drives decode cost, which is memory-bandwidth-bound.
- Payload size distribution — the shape of traffic, not just the volume.
- Modality mix — for multimodal endpoints, images and audio frames have radically different cost profiles than text and need separate accounting.
The mental shift here is the same one databases went through years ago, when “queries per second” gave way to “rows scanned per second” as the real capacity signal. RPS tells you how often something happened. TPS tells you how much work was actually done.
Capacity planning becomes a different exercise too. Instead of “this service handles 5,000 RPS at peak,” you’re saying “this service handles 1.2M output tokens per second sustained, with input/output ratio averaging 4:1.” That’s the number that maps to GPU provisioning.
Errors: the new taxonomy of failure
This is where the model changes most dramatically, and where I see the most teams get caught out.
In a traditional service, errors are explicit: a 5xx response, an exception, a failed health check. Something either worked or it didn’t. The signal is unambiguous.
LLM systems have two error categories, and only one of them shows up in your existing dashboards.
Hard errors are the familiar ones, with a twist worth being precise about. HTTP 400s when prompts exceed the model’s context window (a validation failure, not a capacity one). CUDA OOM under VRAM pressure — typically from KV-cache growth under concurrent load rather than from any single request. HTTP 5xx from the inference server. Timeouts. 429s from third-party model APIs. These are catchable, alertable, and behave like any other infrastructure failure. Your existing tooling already handles them — but note that the remediation differs: context overflows are a prompt-engineering or truncation problem, OOMs are a provisioning problem, and conflating the two in your dashboards will send you debugging in the wrong direction.
Soft errors are the new category, and they’re the dangerous ones:
- Hallucinations — confident, fluent, factually wrong outputs.
- Drift — the same prompt producing materially different responses over time, often after a model version change or fine-tune.
- Low confidence — outputs the model itself flags as uncertain, or that fall below a quality threshold.
- Schema violations — JSON-mode outputs that parse but don’t match the expected structure.
- Refusals — the model declining to answer a request it should have handled.
- Prompt injection success — the model following instructions embedded in user input rather than the system prompt.
Soft errors don’t trigger 5xx alerts. They look like 200 OKs in your logs. They require evaluation infrastructure — golden datasets, LLM-as-judge evaluators, embedding-based drift detection, human review loops — that doesn’t have a direct analogue in traditional SRE.
The operational implication: your error budget needs to account for both. A 99.9% availability target for hard errors is meaningless if 8% of your “successful” responses are hallucinated. Some teams now publish a combined quality SLO that blends infrastructure success with output quality, which I think is the right direction even though it’s harder to compute.
Saturation: GPUs and the rate-limit ceiling
Traditional saturation asks: how full is the tank? CPU, memory, disk I/O, connection pool depth.
For self-hosted models, the tank is a different shape:
- VRAM utilisation — the hard ceiling. Unlike CPU saturation, VRAM exhaustion tends to fail harder and faster. Modern serving stacks (vLLM with CPU offload, continuous batching with KV-cache eviction and request preemption) do offer degradation paths before a true OOM, but they look very different from the gradual response-time creep you’d see on a saturated CPU — and the failure mode beyond those paths is abrupt.
- KV cache pressure — the working memory for in-flight sequences. Saturation here forces queue waits, evictions, or preemption.
- Tensor Core / SM utilisation — the actual compute saturation, often the binding constraint for prefill-heavy workloads.
- Batch occupancy — how full your inference batches are. Under-batched GPUs are wasted money; over-batched ones increase per-request latency.
For services built on third-party APIs (OpenAI, Anthropic, etc.), the saturation model is completely different:
- Tokens per minute (TPM) quotas
- Requests per minute (RPM) quotas
- Concurrent request limits
- Per-key rate limit headroom
You don’t own the hardware, so you can’t see VRAM. What you can see — and must instrument — is your distance from the rate limit ceiling. A service running at 92% of its TPM quota is one traffic spike from cascading 429s, and most teams I’ve worked with don’t alert on this until it’s already happening.
The headline change: saturation is no longer “your servers.” It’s the most constrained resource in the request path, which might be a GPU you own, a quota you don’t, or a context window the prompt is approaching.
The emerging fifth signal: cost
The original four signals were written for a world where compute was cheap, predictable, and owned. LLMs break all three assumptions simultaneously.
When a single poorly-scoped prompt can cost $0.40 in API fees, and a runaway agent loop can burn through a monthly budget in an afternoon, cost stops being a finance problem and becomes an operational one. I’d argue cost deserves to sit alongside the four golden signals as a first-class reliability concern — not because the numbers matter to the SRE (they do, but that’s secondary), because unchecked cost growth is often the earliest signal of a deeper problem: a prompt regression, a caching miss, a model routing failure, or a user-facing loop that shouldn’t exist.
The metrics worth instrumenting:
- Cost per request — the all-in price of a single inference call, including input tokens, output tokens, and any retrieval or tool-call overhead. The baseline to track against.
- Cost per 1K input / output tokens — unit economics by token type. Output tokens are typically 3–5× more expensive than input tokens on most APIs; tracking them separately exposes the asymmetry.
- Cost per conversation — for multi-turn applications, the cumulative cost across a session. A conversation that averages 12 turns at $0.08 each is a different cost profile than one that averages 3 turns at $0.30 each, even if per-request cost looks similar.
- Cost per successful task — the most useful signal for product teams and the one SREs should push for. Divide total inference cost by the number of tasks that actually completed successfully (as defined by your quality SLO). A drop in success rate that isn’t caught by hard errors will show up here as rising cost-per-success before anything else fires.
- Cost by model — if you’re routing across models (e.g. a fast cheap model for classification, a frontier model for generation), breaking down cost by model version reveals whether your routing logic is working as intended. A sudden shift in model distribution is worth alerting on.
- Cost by feature / team / tenant — chargeback visibility. Which product surface is driving spend? In a multi-tenant platform this becomes a fairness and capacity problem, not just a budget one.
The practical implication for SREs: cost metrics belong in the same observability stack as latency and error rate, not in a separate FinOps dashboard that someone checks monthly. Set a cost-per-request budget, alert when it drifts, and treat a 40% spike in token spend the same way you’d treat a 40% spike in p99 latency — as a signal that something has changed and needs investigation.
The mapping at a glance
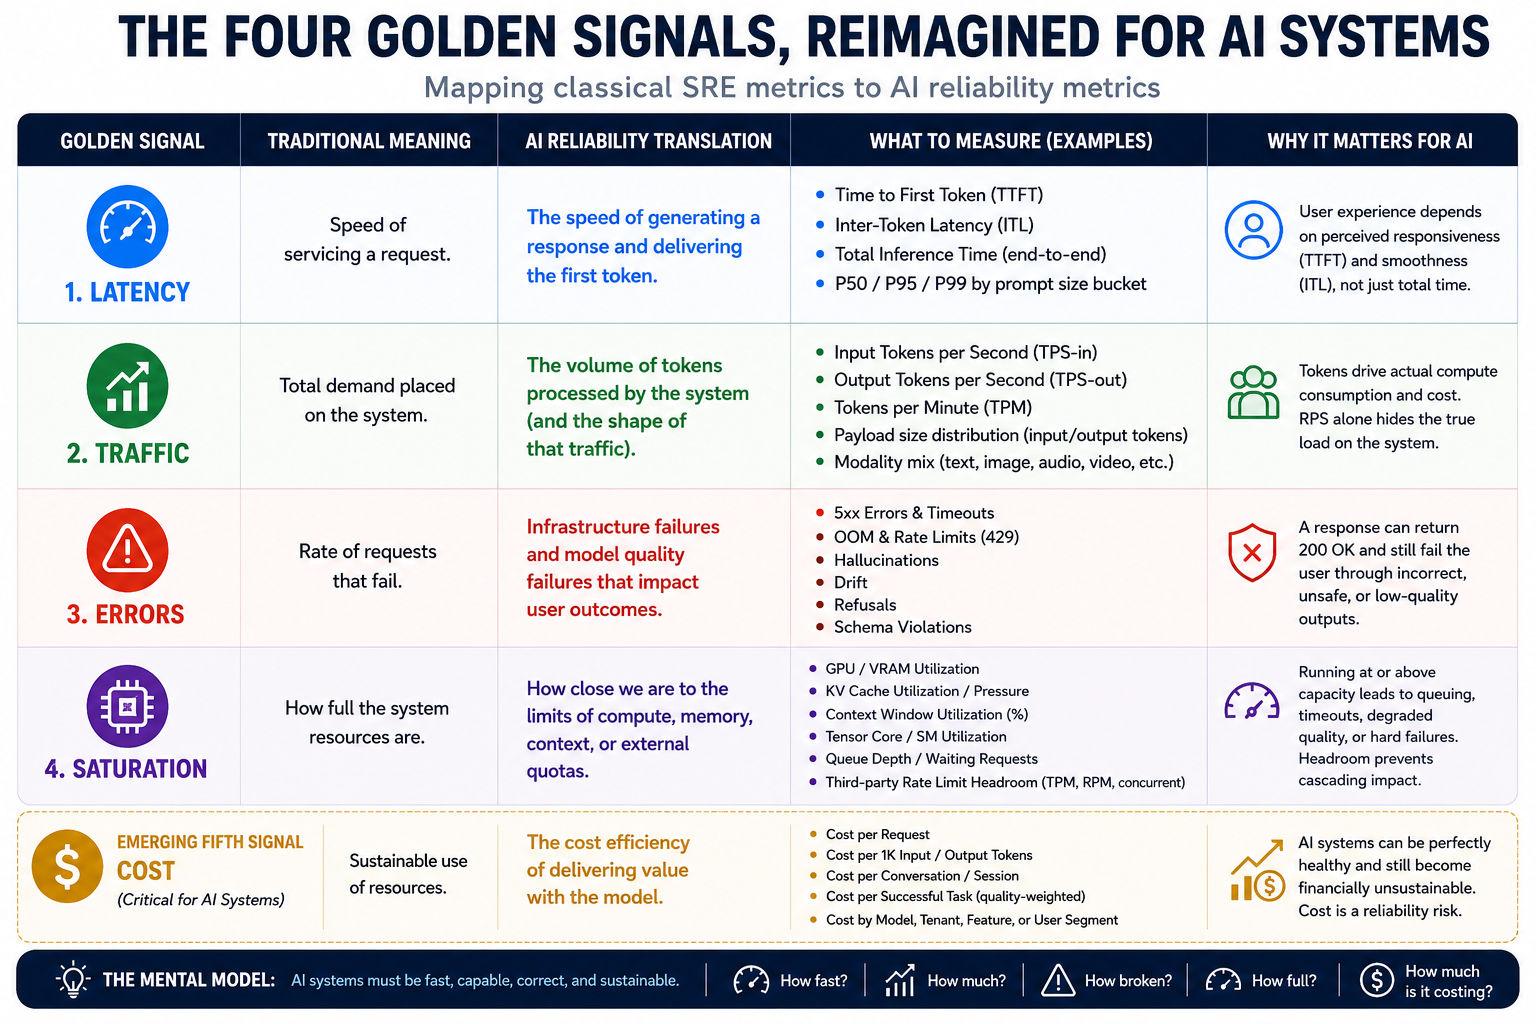
| Signal | Traditional Meaning | AI Reliability Translation |
|---|---|---|
| Latency | Speed of servicing a request | TTFT, inter-token latency, total inference time |
| Traffic | Total demand on the system | Tokens/sec (in & out), payload size, modality mix |
| Errors | Explicitly failed requests | Hard errors (OOM, 5xx) + soft errors (hallucination, drift, schema violation, prompt injection) |
| Saturation | How full system resources are | VRAM, KV cache, Tensor Core utilisation, third-party API rate-limit headroom |
| Cost (emerging) | — | Cost per request, per 1K tokens, per conversation, per successful task, by model |
What this means for the SRE craft
Your existing tooling does about half the job. Datadog, Prometheus, Grafana, OpenTelemetry — they all instrument the hard side of the picture beautifully. What they don’t natively give you is the soft-error layer. You’ll need evaluation infrastructure, whether that’s an in-house eval harness, an LLM observability platform (Langfuse, Arize, Helicone, etc.), or a periodic offline eval pipeline. Treat it as a first-class production system, not a notebook someone runs occasionally.
SLOs need to combine availability and quality. A pure uptime SLO is no longer sufficient. The pattern I’d push toward is a quality-weighted SLO: a request counts as “successful” only if it returned 2xx, completed within latency budget, and passed a quality threshold (eval score, schema validation, hallucination check). This is harder to compute but maps to what users actually care about.
Capacity planning becomes token-economic. Provisioning decisions need to be expressed in tokens, not requests, and need to account for the input/output ratio of your workload. The good news: this discipline is exactly the same shape as traditional capacity planning, just with a different unit.
Incident response gets a new category. “The model started hallucinating after the 14:00 deployment” is now a legitimate incident, not a product complaint. Your runbooks need to include rollback procedures for model versions, prompt template changes, and fine-tune deployments — not just code.
Closing thought
The framing I keep coming back to: the golden signals were never really about CPU and HTTP. They were about asking four fundamental questions of any service — how fast, how much, how broken, how full. Those questions still apply to AI workloads. What’s changed is the answer sheet.
If you’re an SRE moving into AI ops, you don’t need to throw out the playbook. You need to translate it. The discipline of measuring what matters, setting objectives, and operating to them is exactly the same. The metrics are just wearing different clothes.
Written for SRE and platform engineers crossing into AI operations. If you’re working on this transition and want to compare notes, I’d love to hear what’s working — and what isn’t — in your stack.
Comments 6
The 'dashboard stopped making sense' line is exactly what happened to us the first week our LLM service went live. Latency looked fine, errors looked fine, and users were still complaining constantly.
Saturation for an LLM workload is such a different beast — GPU memory and KV cache pressure don't show up on any of our traditional CPU/memory dashboards at all.
Agreed that this shouldn't be a separate discipline. We tried spinning up a dedicated 'AI observability' team and it just duplicated half of what platform already owned.
Redefining 'errors' for an LLM is the hardest one for us. A 200 response with a hallucinated answer is a correctness failure that none of our error-rate alerts would ever catch.
Latency for streaming token generation needs its own definition too — time to first token versus total completion time tell completely different stories about user experience.
This is the clearest mental model I've read for translating SRE fundamentals onto LLM services instead of starting from scratch with unfamiliar AI-specific vocabulary.