How to structure your observability stack to answer the only question that matters: “Can the user do what they came here to do?”
There is a classic paradox in SRE: The dashboard is all green, but the users are complaining.
How does this happen? It happens when we monitor components instead of journeys. Your database might be healthy, and your API might be responding with 200 OKs, but if the logic connecting them is broken, the user is stuck.
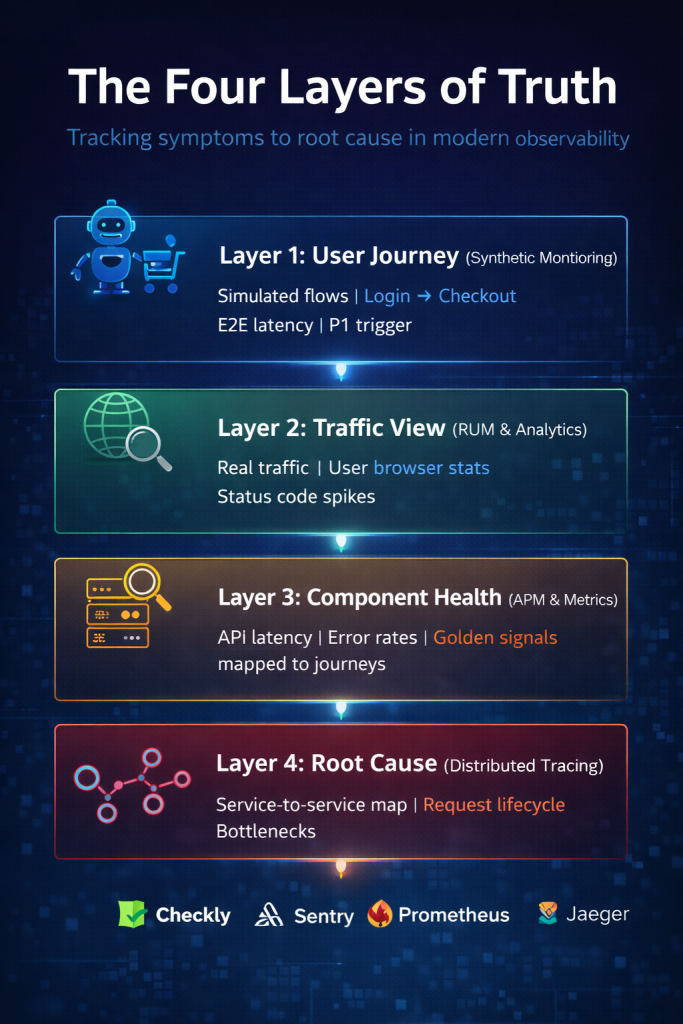
To truly equip a team for incident response, we need to monitor the system in layers, zooming in from the user’s experience down to the line of code. Here is the architectural blueprint for End-to-End (E2E) Observability.
Layer 1: The User Journey (Synthetic Monitoring)
The “Outside-In” Perspective
This is your first line of defense. Before a real user even logs in, a “Synthetic User” (a robot script) should be attempting to complete critical user journeys every minute. We don’t just check if the homepage loads. We simulate the actual business logic:
- Login
- Search for Item
- Add to Cart
- Checkout
What we measure here:
- Journey Success Rate: Did the robot complete the purchase?
- E2E Latency: How long did the entire flow take?
- Availability: Is the front door open?
If this alarm goes off, it is a P1 Incident, regardless of what your other dashboards say.
Layer 2: The Traffic View (Web Analytics & RUM)
The “Real World” Perspective
Synthetics are great, but they are sterile. They run in clean environments. To understand reality, we need Real User Monitoring (RUM) and Web Analytics. This layer analyzes the actual incoming traffic flood. It aggregates the experience of thousands of humans.
What we measure here:
- Traffic Volume: Is traffic suspiciously low? (Maybe the DNS is broken.)
- Status Codes: Are we seeing a spike in 5xx (Server Errors) or 4xx (Client Errors)?
- Browser Performance: Is the site slow only for Chrome users on mobile?
Layer 3: Component Health (APM & API Metrics)
The “Inside-Out” Perspective
Once Layer 1 or 2 tells us something is wrong, Layer 3 tells us where it is wrong. This is where we map the User Journey to the Critical API Endpoints.
If the “Checkout” journey fails, which specific API is responsible? Is it POST /cart/checkout? Or is it the downstream GET /inventory? We must monitor these critical endpoints using the Golden Signals, but we must explicitly link them to the journey.
| Approach | Result |
|---|---|
| Dashboard shows “API Error Rate” | Unhelpful — no journey context |
| Dashboard shows “Checkout Journey Risk: Inventory API is throwing 500s” | Actionable — maps component to user impact |
Layer 4: The Root Cause (Distributed Tracing)
The “X-Ray” Perspective
This is the most powerful tool in the modern stack. When you have microservices, a single user click might touch 20 different services. If one fails, how do you know?
Distributed Tracing allows you to visualize the request lifecycle as it hops from the Load Balancer → Front End → API Gateway → Auth Service → Database.
What this solves: It prevents the “Blame Game.” Without tracing, the Frontend team blames the Backend team, who blames the Database team. With tracing, we can see exactly where the latency spike occurred. “It’s not the database; it’s the 3rd-party Payment Gateway timing out.”
Implementation: The Tooling Matrix
You don’t need to buy a single expensive platform to build this. You can mix and match based on your budget.
| Layer | SaaS Path (Buy) | Open Source Path (Build) |
|---|---|---|
| 1. Synthetics | Datadog Synthetics, Checkly | Playwright (CI/CD), Prometheus Probing |
| 2. RUM | Sentry, Datadog RUM | OpenReplay, Matomo |
| 3. APM | New Relic, AppDynamics, Datadog | Prometheus + Grafana |
| 4. Tracing | Honeycomb, Lightstep, Datadog | Jaeger, Tempo |
Architect’s Note: Regardless of which tool you pick, I strongly recommend using OpenTelemetry (OTel) to collect the data. OTel ensures you aren’t locked into a vendor’s proprietary agent forever.
Conclusion: The Mapping Strategy
The ultimate goal of this strategy is Dependency Mapping. Your dashboards should tell a story. They should visualize that User Journey A depends on APIs X, Y, and Z.
If API X breaks, the dashboard should predict that User Journey A is impacted. When you link these four layers—Synthetics, Analytics, APM, and Tracing—you stop monitoring servers and start monitoring the business.
Comments 3
The journey layer is the piece most dashboards completely skip. We have perfect per-service metrics and still get blindsided by cross-service journeys breaking silently.
This matches our experience almost exactly — server health looked perfect during a checkout outage last quarter because the failure was entirely in a third layer we weren't tracking at all.
Would love to see a concrete worked example of instrumenting a journey end to end, including how you handle journeys that span both frontend and backend telemetry.